Fig. 12
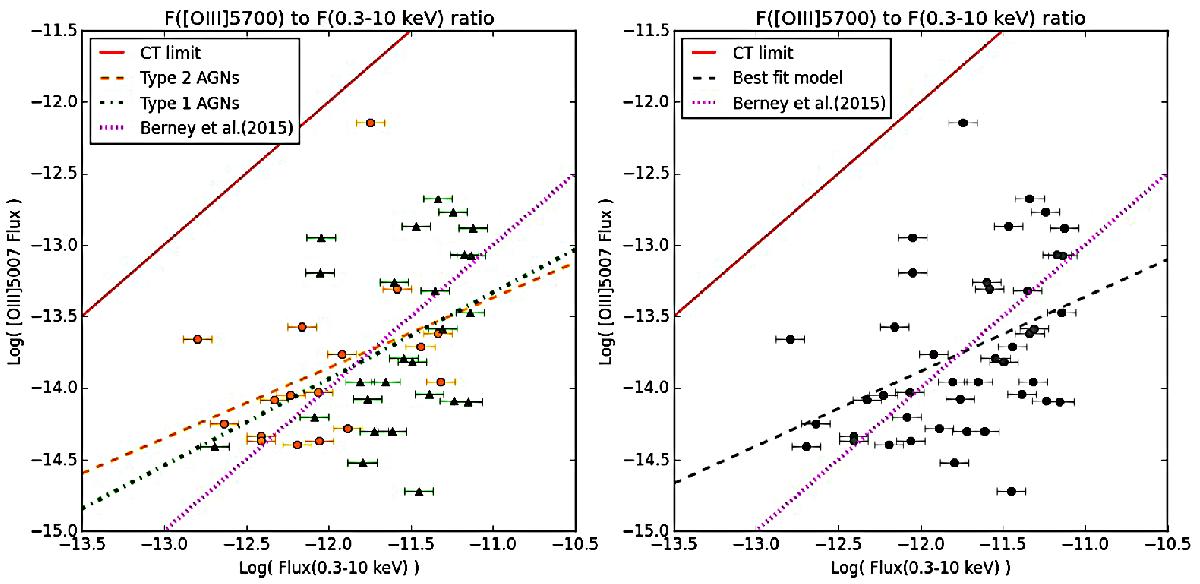
Distribution of the [OIII]λ5007 to 0.3−10 keV ratio for the AGNs of our sample and corresponding best-fit correlations (see text for details). Red continuous line represents the locus for which the parameter T is equal to 1 and the dotted pink line indicates the Berney et al. (2015) relation for the ratio between the soft X-ray flux and the [OIII]λ5007 unabsorbed flux.
Current usage metrics show cumulative count of Article Views (full-text article views including HTML views, PDF and ePub downloads, according to the available data) and Abstracts Views on Vision4Press platform.
Data correspond to usage on the plateform after 2015. The current usage metrics is available 48-96 hours after online publication and is updated daily on week days.
Initial download of the metrics may take a while.