Free Access
Fig. 10
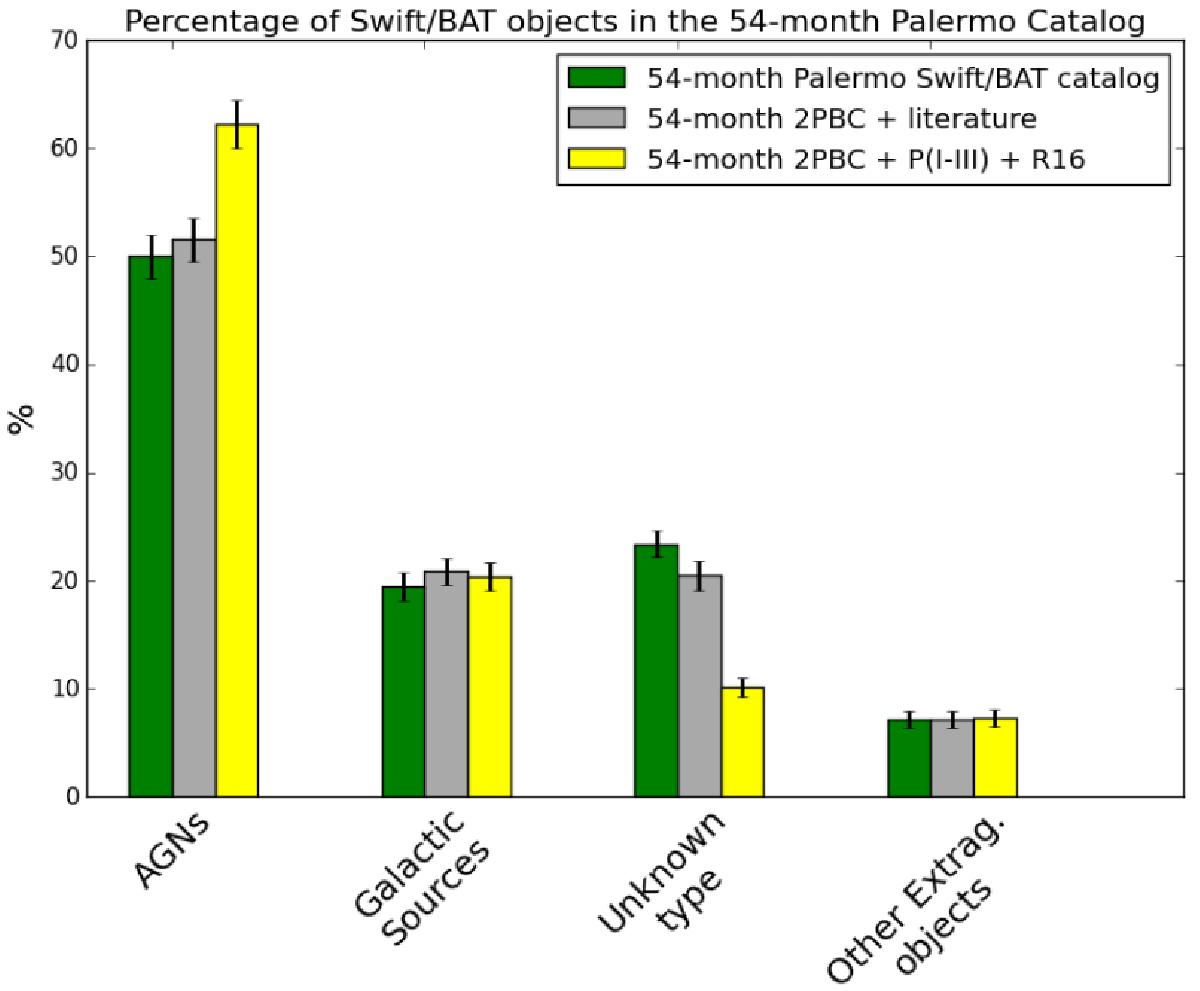
Histogram, subdivided into source types, showing how the initial percentage of objects in the 54 months Palermo Swift-BAT catalogue (in green) has changed by means of the identifications performed by other authors (in grey) and by our group in PI-PIII and in this work (R16) (in yellow).
Current usage metrics show cumulative count of Article Views (full-text article views including HTML views, PDF and ePub downloads, according to the available data) and Abstracts Views on Vision4Press platform.
Data correspond to usage on the plateform after 2015. The current usage metrics is available 48-96 hours after online publication and is updated daily on week days.
Initial download of the metrics may take a while.