Free Access
Fig. 5
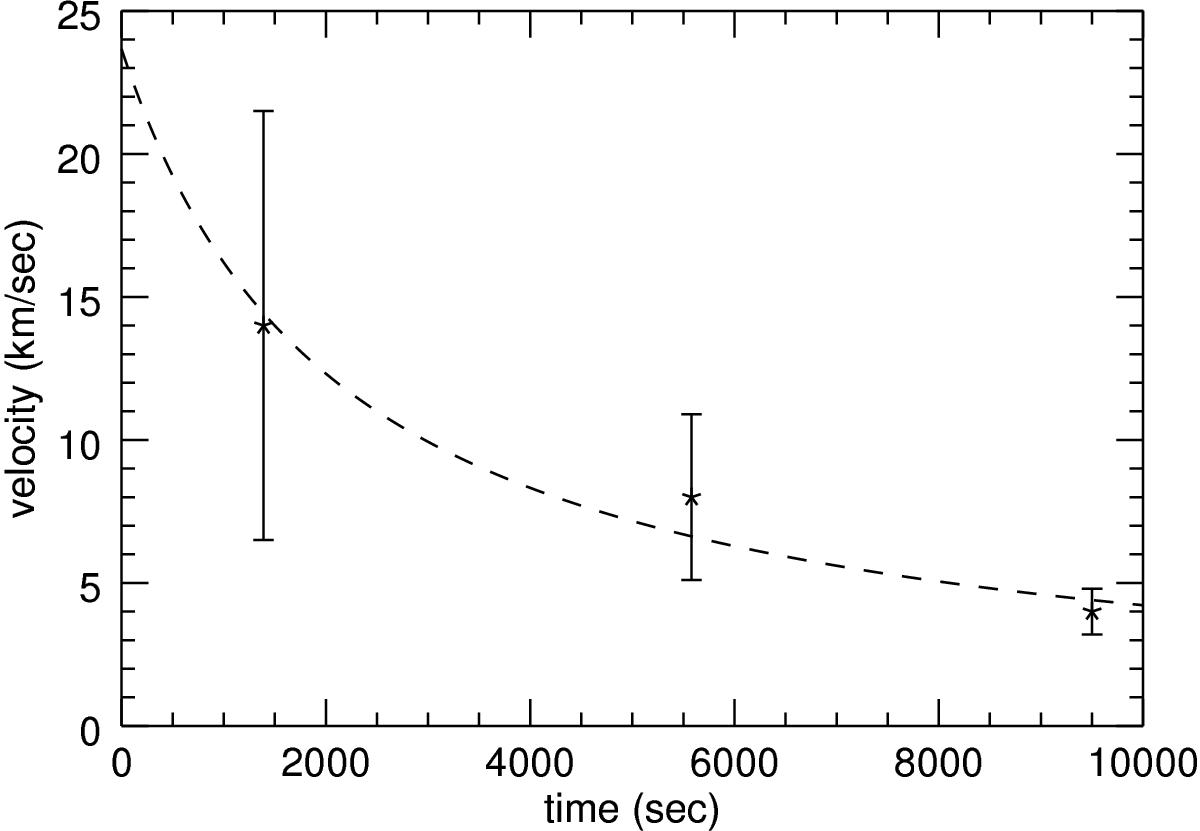
Overview of the apparent phase velocities over time. The time for each velocity corresponds with the time when the first maximal amplitude was reached for that wave at height 0. The dotted line is the fitted phase velocity using Eq. (35).
Current usage metrics show cumulative count of Article Views (full-text article views including HTML views, PDF and ePub downloads, according to the available data) and Abstracts Views on Vision4Press platform.
Data correspond to usage on the plateform after 2015. The current usage metrics is available 48-96 hours after online publication and is updated daily on week days.
Initial download of the metrics may take a while.