Fig. 3
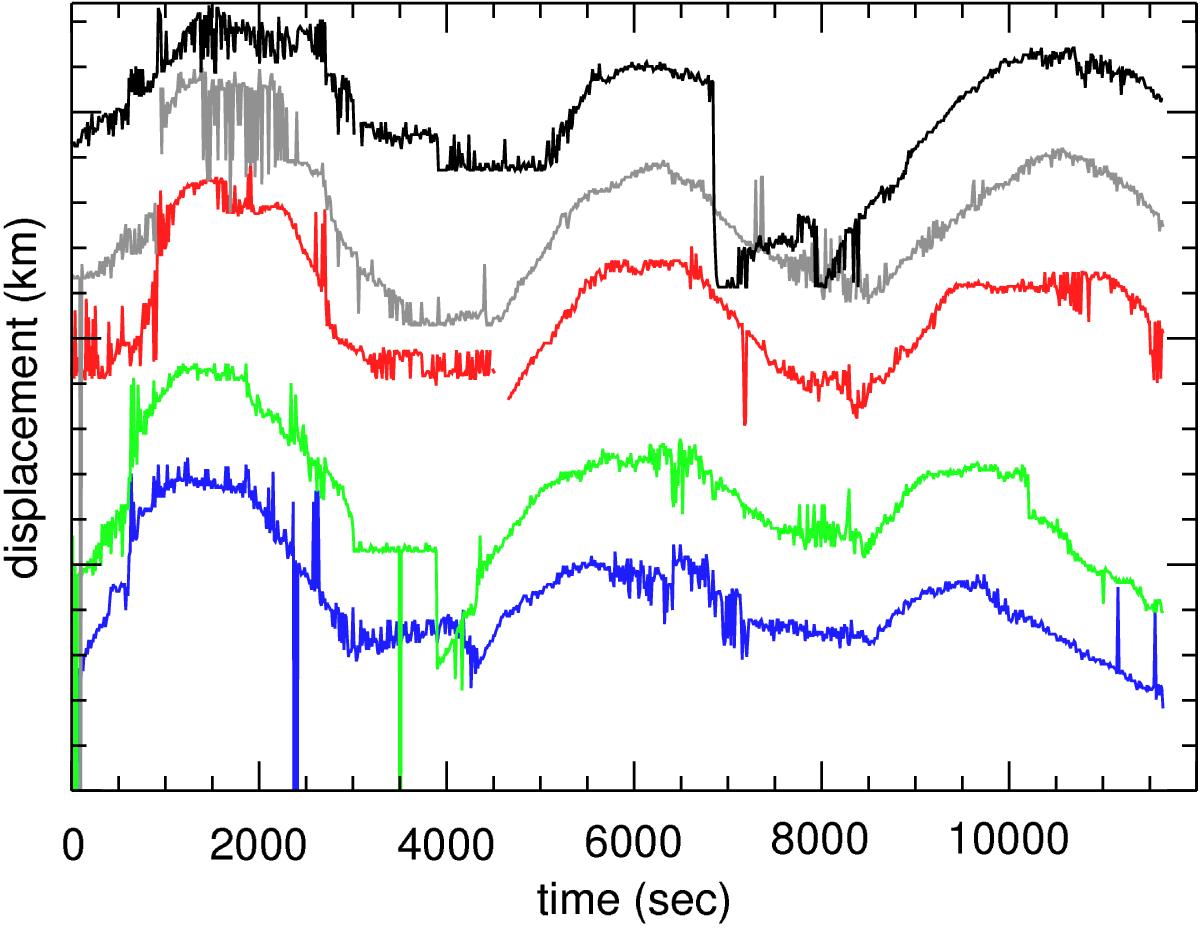
Displacement measurements of the filament at all heights. The blue curve is at a height of 0 km, the green curve at height 2175 km, the red curve at height 6527 km, the grey curve at height 8703 km, and the black curve at height 10 879 km; these are projected heights. The time difference between maxima for subsequent slices is smallest during the first maximum, larger for the second maximum, and largest for the third maximum.
Current usage metrics show cumulative count of Article Views (full-text article views including HTML views, PDF and ePub downloads, according to the available data) and Abstracts Views on Vision4Press platform.
Data correspond to usage on the plateform after 2015. The current usage metrics is available 48-96 hours after online publication and is updated daily on week days.
Initial download of the metrics may take a while.