Fig. 1
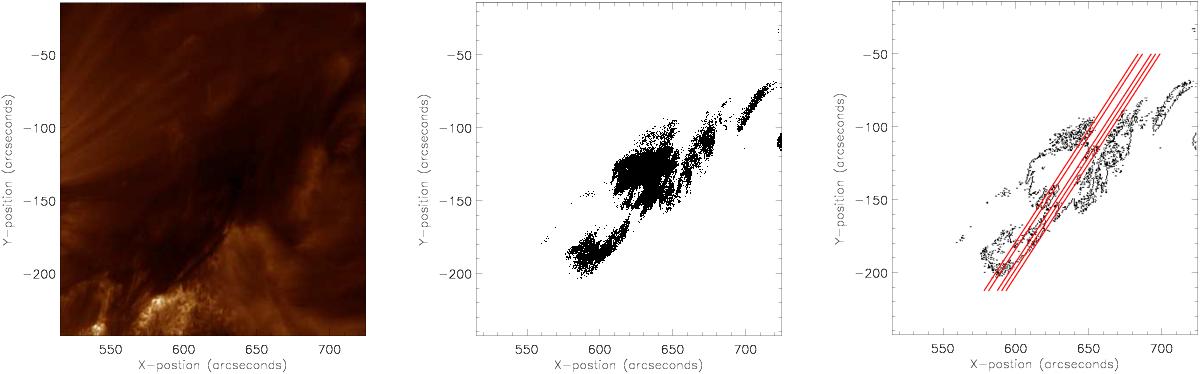
Prominence observed by AIA on 2015 March 15 at 03:10 in the 193 Å channel. The left panel shows the data in a non-manipulated format. The darker area denotes the filament and the brighter area is the solar background. The temporal evolution as seen in AIA 193 channel is available online. The middle panel shows the data set after a first manipulation by using a cut-off value. In this format, the prominence can be seen as a black shape against a white background. Compared to the non-manipulated data, the prominence can be seen much more clearly. The right panel shows the data after a final manipulation: in this format only the prominence edges are displayed. The red lines over the prominence are the different slices at which the displacement measurements are taken.
Current usage metrics show cumulative count of Article Views (full-text article views including HTML views, PDF and ePub downloads, according to the available data) and Abstracts Views on Vision4Press platform.
Data correspond to usage on the plateform after 2015. The current usage metrics is available 48-96 hours after online publication and is updated daily on week days.
Initial download of the metrics may take a while.