Fig. 6
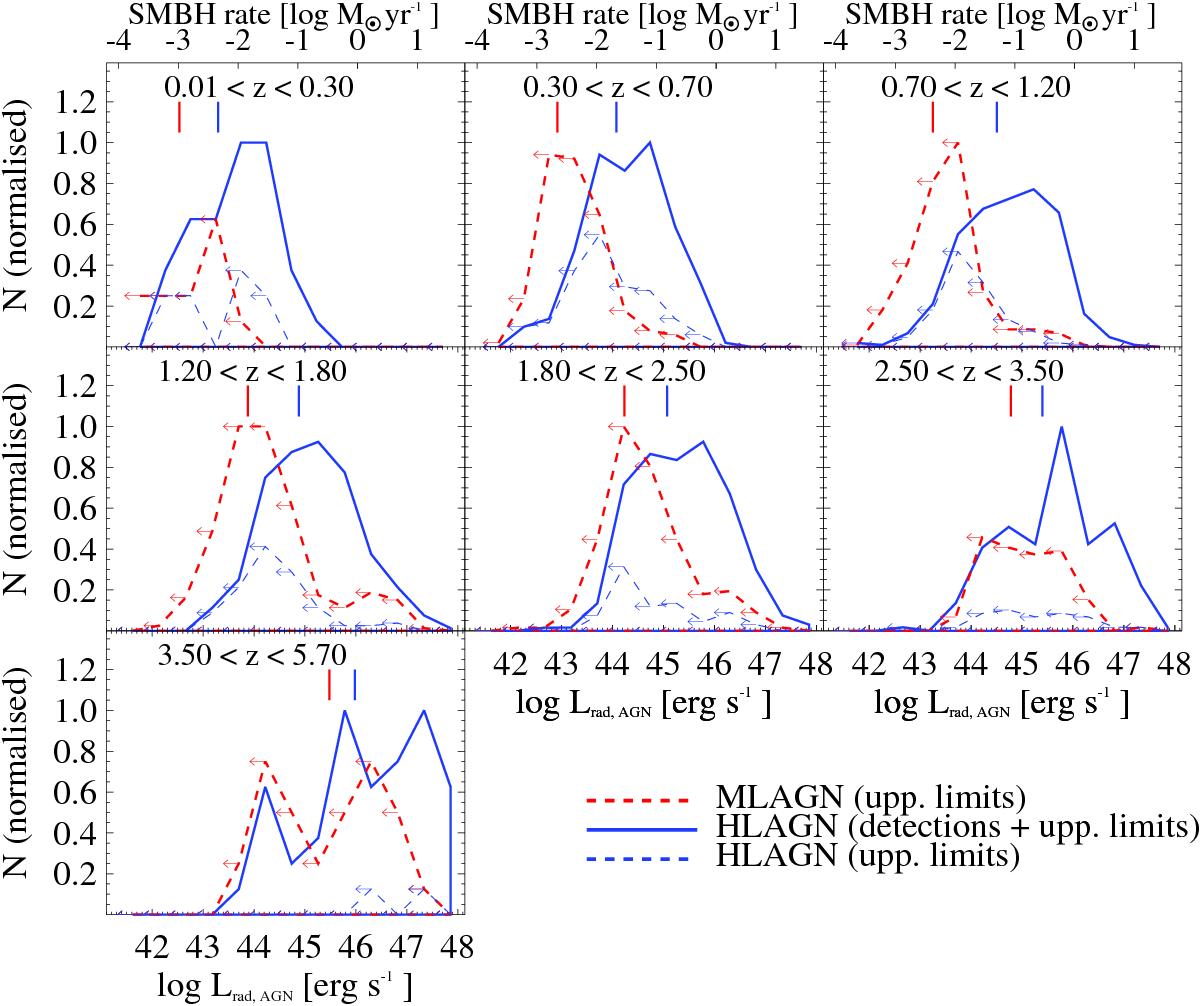
Normalised distribution of Lrad,AGN (or BHAR), as a function of redshift, separately for MLAGN (red dashed) and HLAGN (blue solid). The subsample of HLAGN not identified as “SED-AGN” (27% of all HLAGN) is represented by the blue dashed distribution. The left-pointing arrows indicate upper limits at 90% confidence level in Lrad,AGN for the corresponding distribution.
Current usage metrics show cumulative count of Article Views (full-text article views including HTML views, PDF and ePub downloads, according to the available data) and Abstracts Views on Vision4Press platform.
Data correspond to usage on the plateform after 2015. The current usage metrics is available 48-96 hours after online publication and is updated daily on week days.
Initial download of the metrics may take a while.