Fig. 5
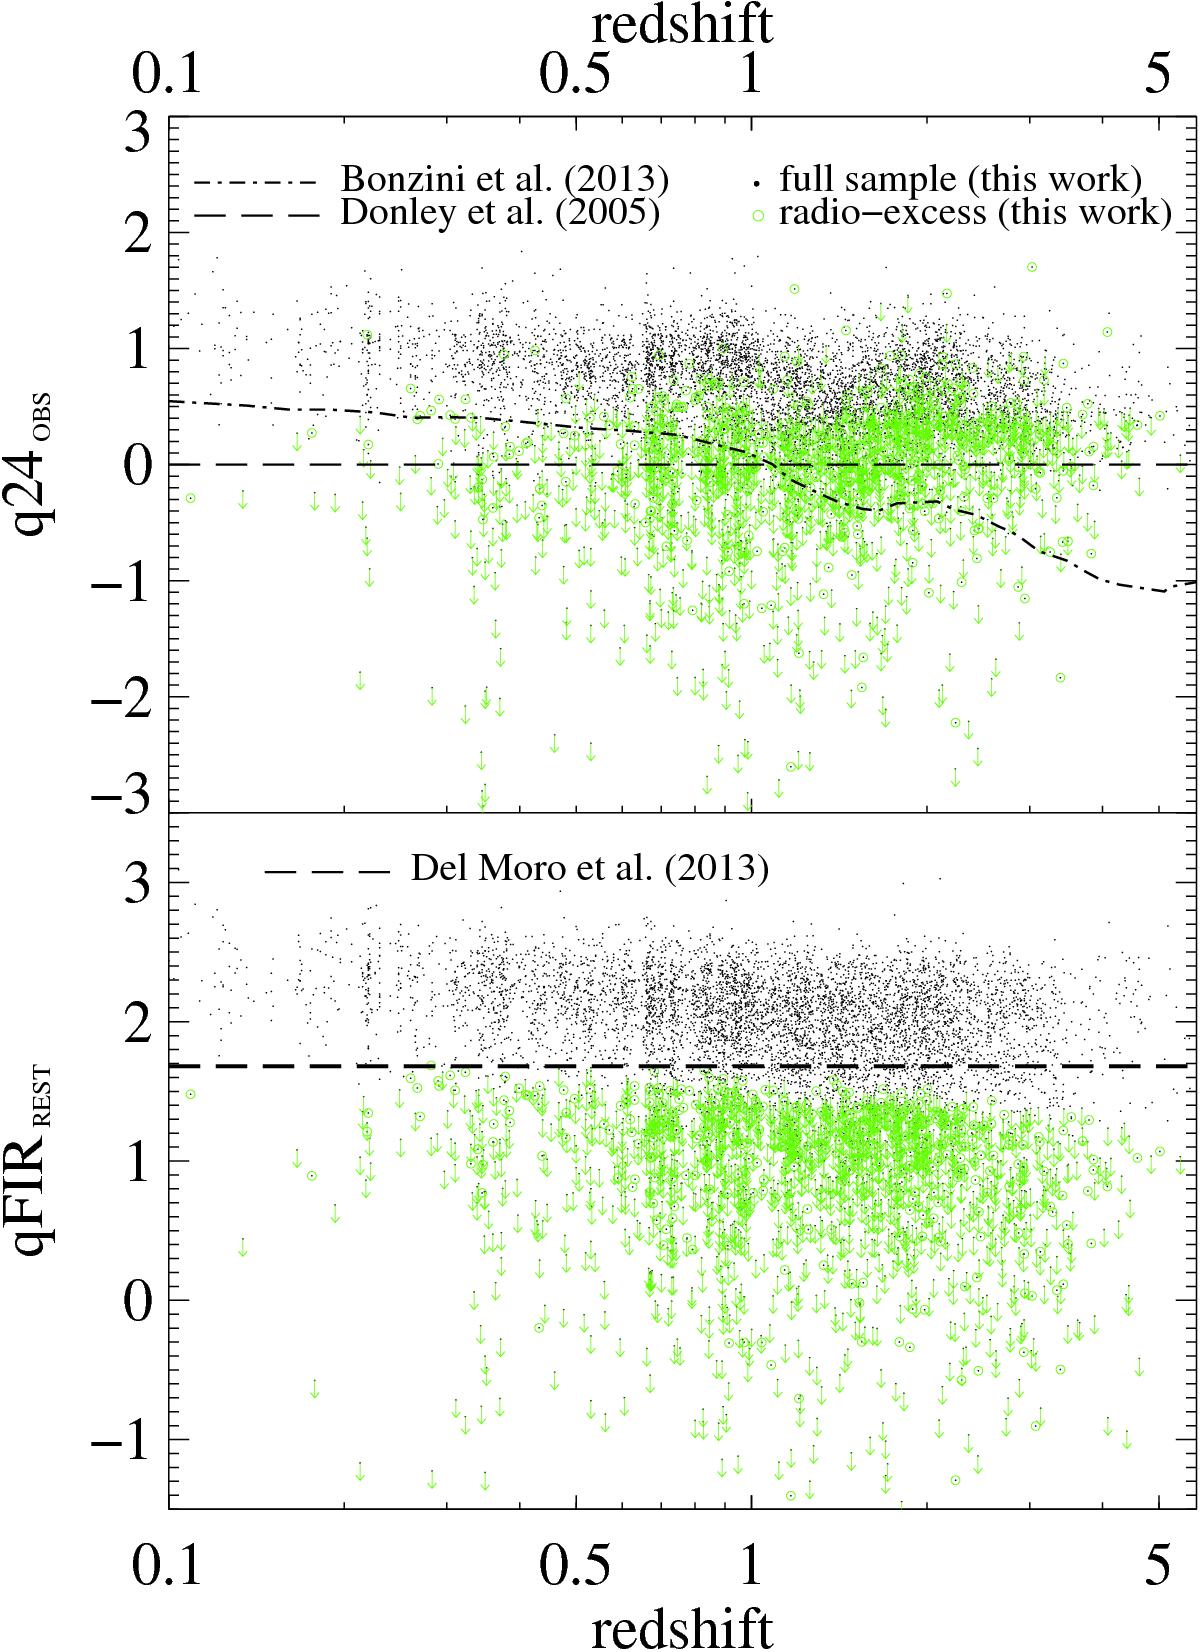
Redshift distribution of q24,obs (top panel) and qFIR (bottom panel) for our 3 GHz sample (black dots). The subsample with radio excess is highlighted with green circles. The dash-dotted line (top panel) indicates the radio-excess threshold by Bonzini et al. (2013, B13), while the horizontal dashed line indicates the threshold in q24,obs defined by Donley et al. (2005). The dashed line of the bottom panel indicates the threshold in the rest-frame qFIR identified by Del Moro et al. (2013).
Current usage metrics show cumulative count of Article Views (full-text article views including HTML views, PDF and ePub downloads, according to the available data) and Abstracts Views on Vision4Press platform.
Data correspond to usage on the plateform after 2015. The current usage metrics is available 48-96 hours after online publication and is updated daily on week days.
Initial download of the metrics may take a while.