Fig. 4
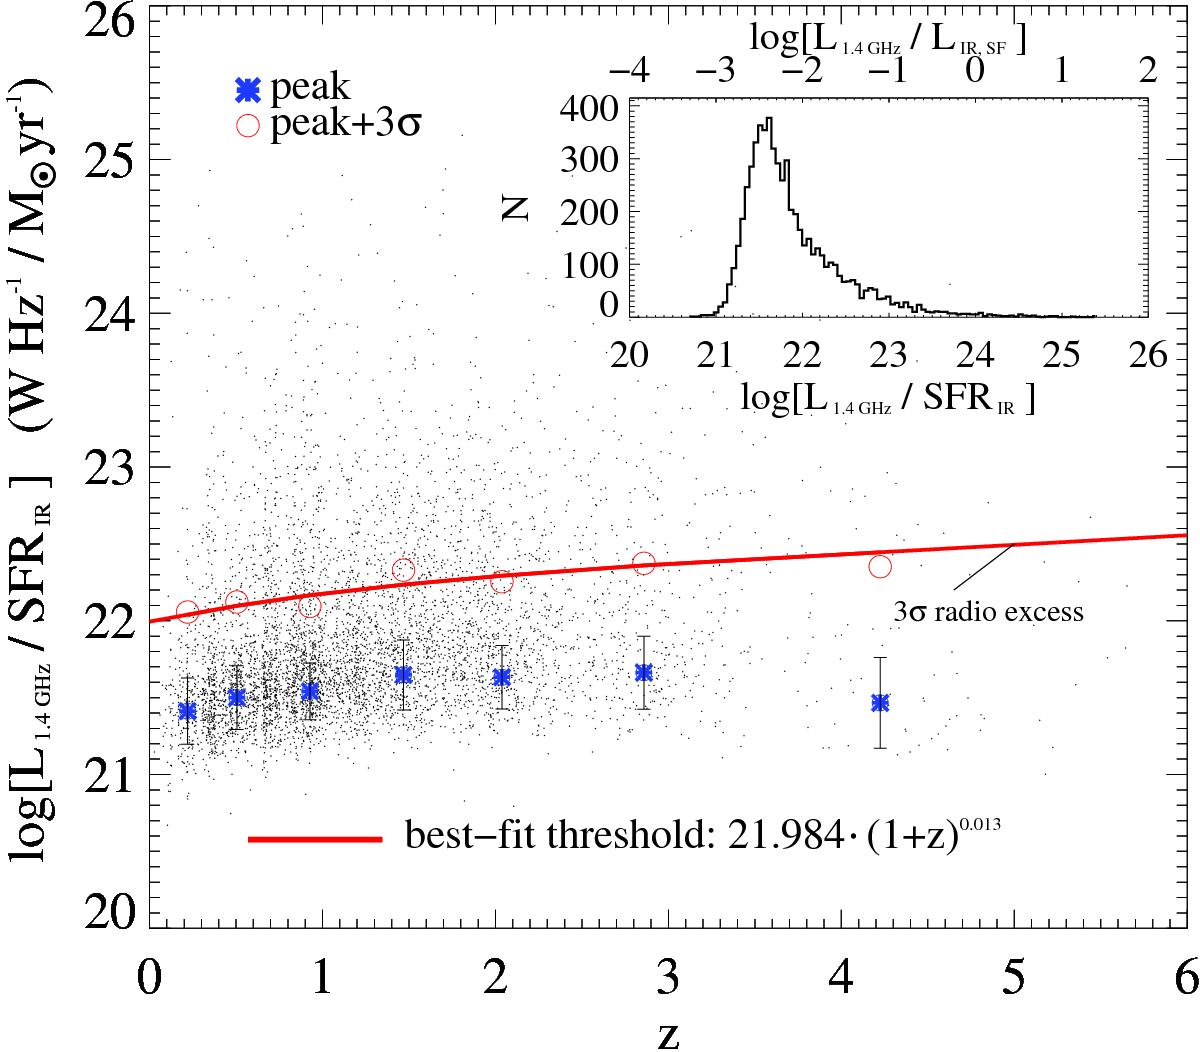
Distribution of the ratio between L1.4 GHz and SFRIR as a function of redshift (black points) for sources not classified as HLAGN (79% of our sample). The blue filled circles (and errors) indicate the peak (and dispersion) of the Gaussian distribution identified in a given redshift bin, while the corresponding 3σ deviation is set by the red open circles. The red solid line indicates the redshift-dependent threshold derived by fitting the open circles at each redshift bin. Sources above the red line are identified as “low to moderate radiative luminosity AGN” (hereafter MLAGN) via radio excess. The full histogram of L1.4 GHz/SFRIR is shown in the top right corner.
Current usage metrics show cumulative count of Article Views (full-text article views including HTML views, PDF and ePub downloads, according to the available data) and Abstracts Views on Vision4Press platform.
Data correspond to usage on the plateform after 2015. The current usage metrics is available 48-96 hours after online publication and is updated daily on week days.
Initial download of the metrics may take a while.