Fig. 3
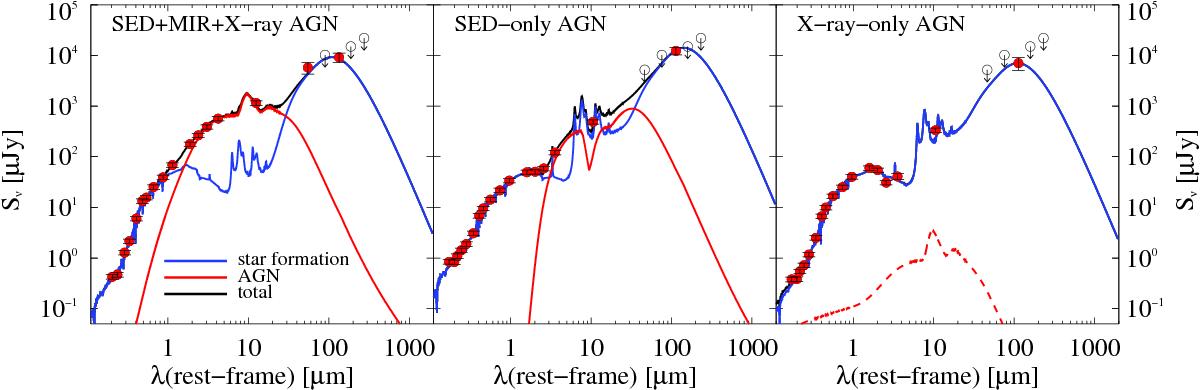
Three examples of best-fit SEDs of HLAGN selected from different criteria. Coloured lines represent the corresponding best-fit templates of AGN (red), galaxy star formation (blue), and the sum of the two (black). Left panel: AGN identified from X-rays, MIR colours, and SED fitting. Central panel: AGN identified only from SED-fitting. Right panel: AGN identified only from X-rays. The red dashed line indicates that the AGN component is <99% significant on the basis of the Fisher test (see text for more details). Red circles indicate the optical to far-IR (FIR) photometry (rest-frame), while downward pointing arrows represent 3σ upper limits in the Herschel bands.
Current usage metrics show cumulative count of Article Views (full-text article views including HTML views, PDF and ePub downloads, according to the available data) and Abstracts Views on Vision4Press platform.
Data correspond to usage on the plateform after 2015. The current usage metrics is available 48-96 hours after online publication and is updated daily on week days.
Initial download of the metrics may take a while.