Free Access
Fig. 2
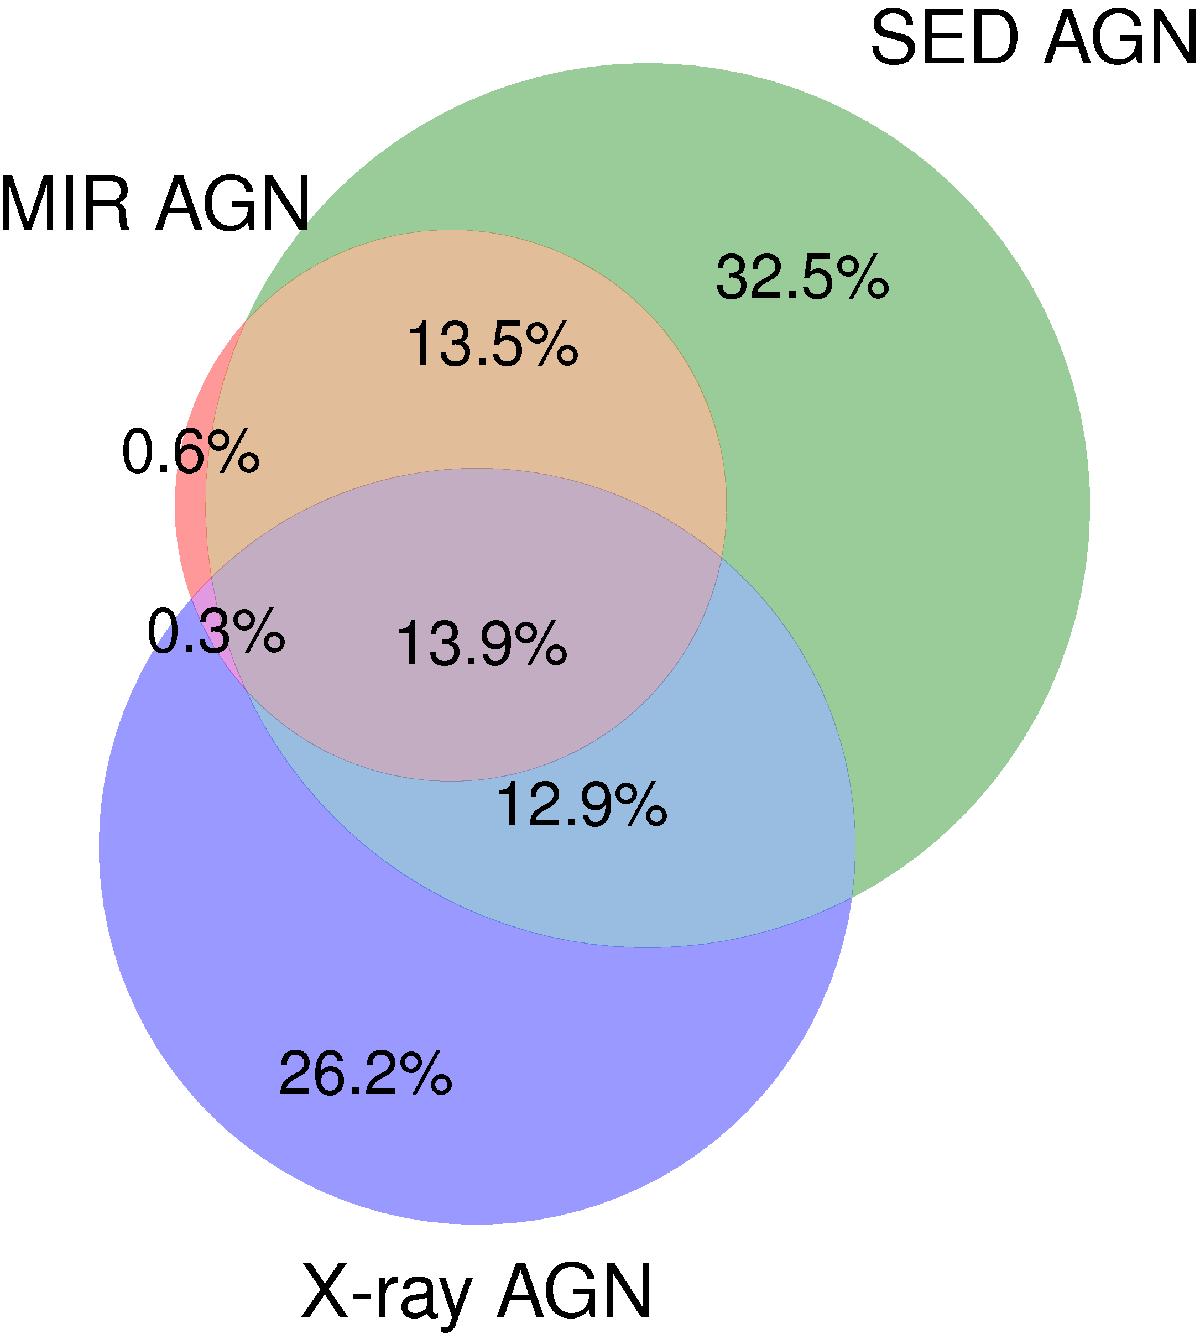
Venn diagram illustrating the percentages of the 1 604 HLAGN in our sample identified from different AGN diagnostics: X-rays (blue), MIR (red) and SED decomposition (green). Areas roughly scale with percentages.
Current usage metrics show cumulative count of Article Views (full-text article views including HTML views, PDF and ePub downloads, according to the available data) and Abstracts Views on Vision4Press platform.
Data correspond to usage on the plateform after 2015. The current usage metrics is available 48-96 hours after online publication and is updated daily on week days.
Initial download of the metrics may take a while.