Fig. 11
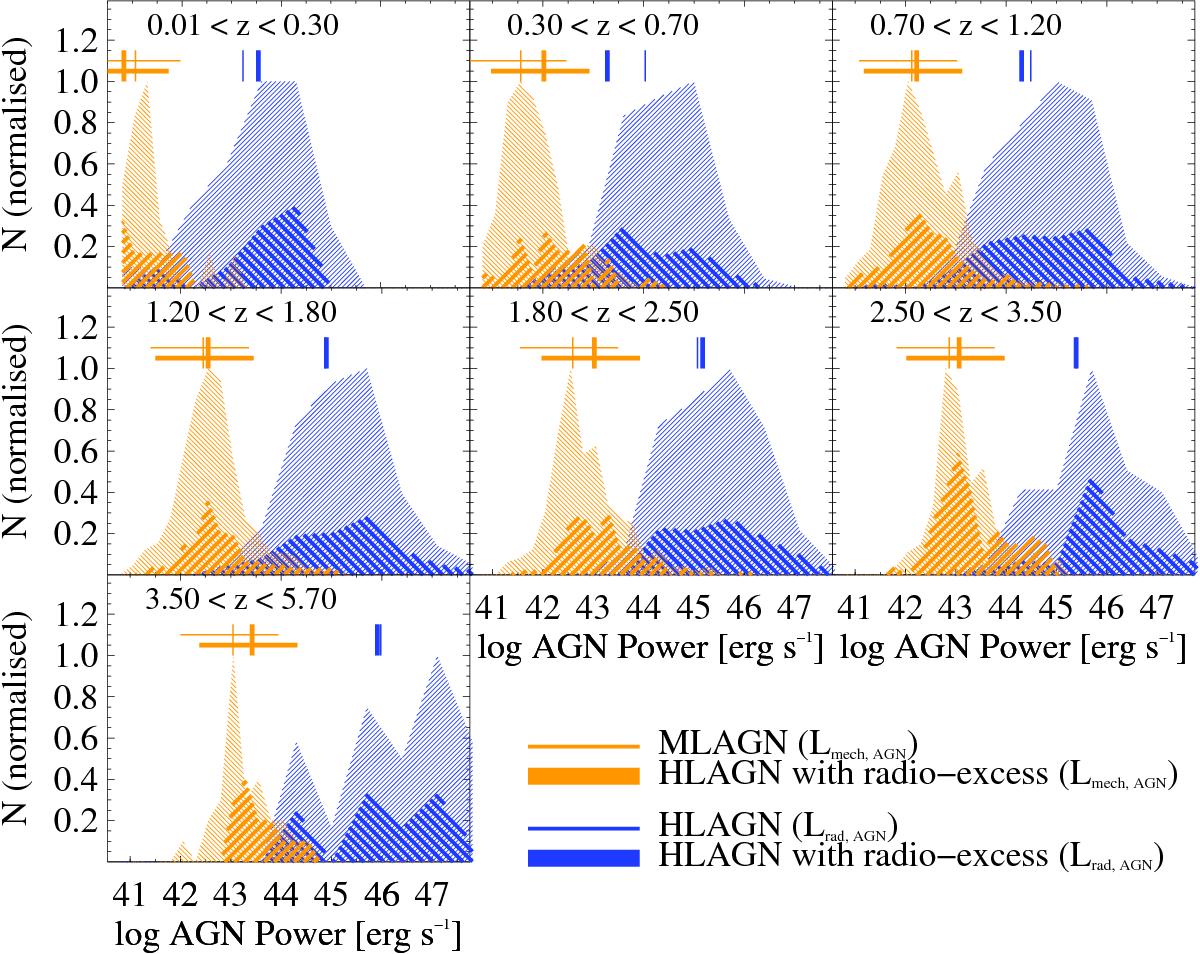
Normalised distributions of AGN power, both radiative (Lrad,AGN) and mechanical (Lmech,AGN) as a function of redshift. The distributions of Lrad,AGN are shown for HLAGN (blue) and HLAGN with radio excess (blue thicker), while the distributions of Lmech,AGN are shown only for MLAGN (orange) and HLAGN with radio excess (orange thicker). The median value of each distribution is indicated with a vertical line with same colour and thickness of the corresponding histogram. The orange horizontal lines around the median value of the AGN mechanical power show the range within which the median could shift if accounting for all of the uncertainties on the L1.4 GHz–Lmech,AGN relation (see text for details). The normalisations are set separately for the two Lmech,AGN (red) and the two Lrad,AGN (blue) distributions. See the text for details.
Current usage metrics show cumulative count of Article Views (full-text article views including HTML views, PDF and ePub downloads, according to the available data) and Abstracts Views on Vision4Press platform.
Data correspond to usage on the plateform after 2015. The current usage metrics is available 48-96 hours after online publication and is updated daily on week days.
Initial download of the metrics may take a while.