Fig. 1
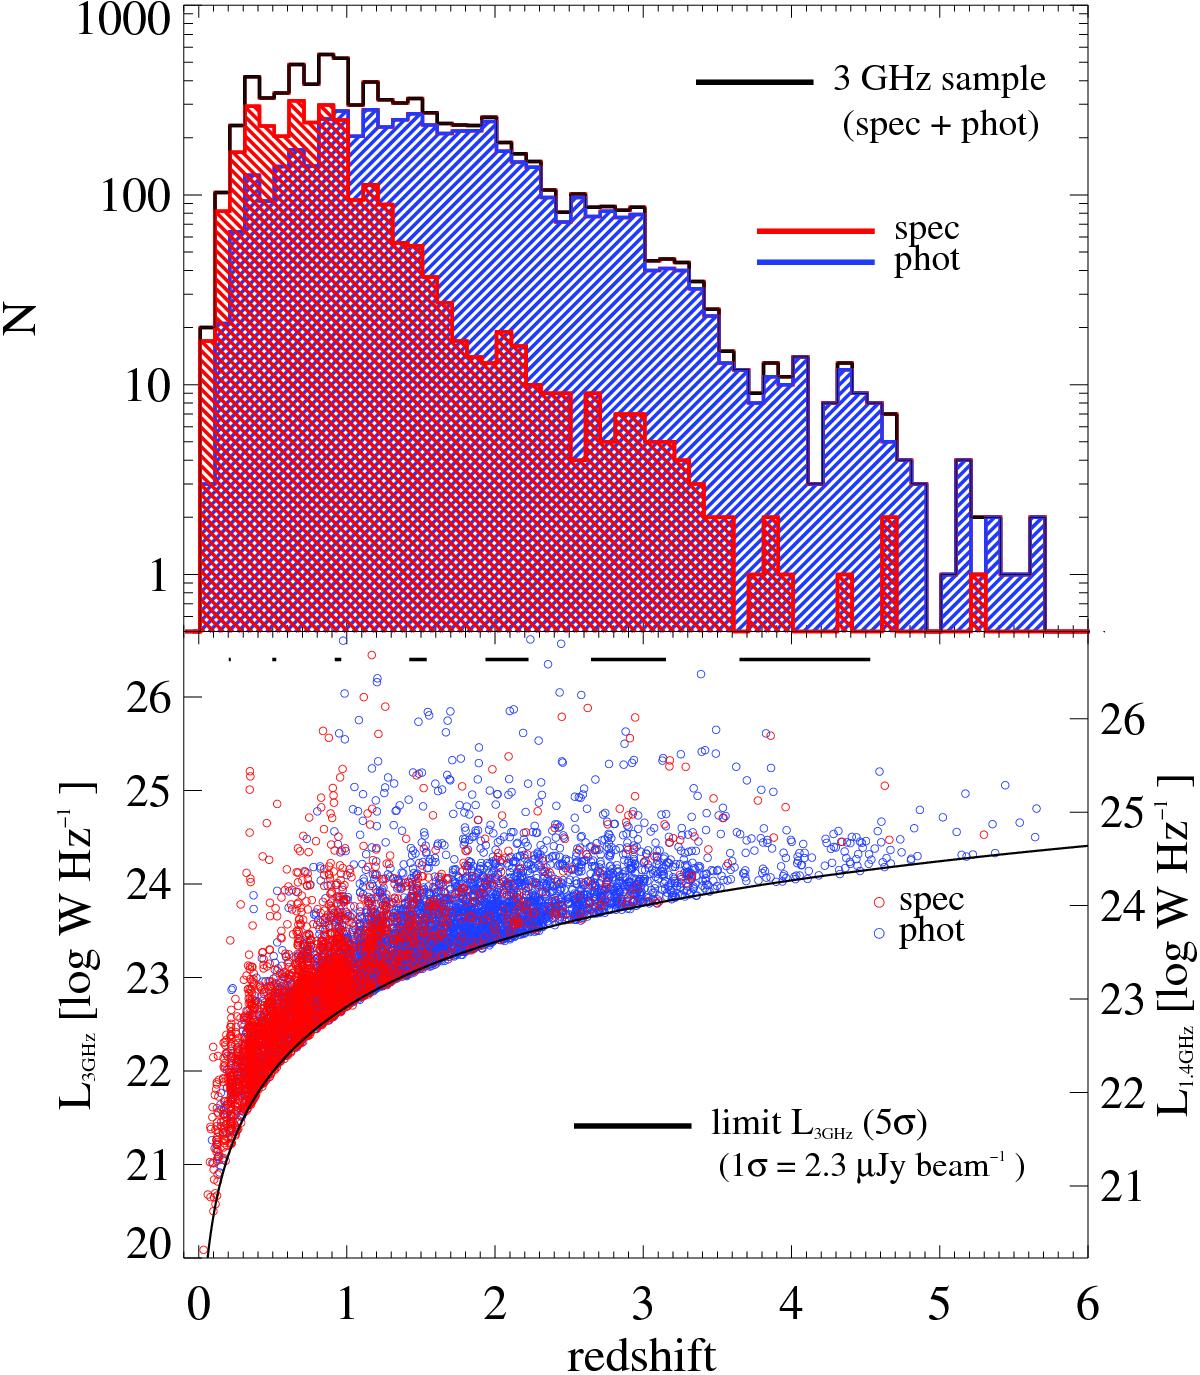
Top panel: redshift distribution of our 7729 radio sources. Spectroscopic and photometric redshifts are shown in red and blue, respectively, while the black line is the sum of the two. The scale of the y axis is logarithmic. Bottom panel: circles show the rest-frame 3 GHz luminosity as a function of redshift, both spectroscopic (red) and photometric (blue). The horizontal bars indicates the average ±1σ uncertainty range of the photometric redshifts in the various redshift bins. The corresponding 1.4 GHz luminosity (scaled by using α = –0.7) is shown for comparison on the right y axis. The black solid line indicates the 5σ luminosity limit at 3 GHz.
Current usage metrics show cumulative count of Article Views (full-text article views including HTML views, PDF and ePub downloads, according to the available data) and Abstracts Views on Vision4Press platform.
Data correspond to usage on the plateform after 2015. The current usage metrics is available 48-96 hours after online publication and is updated daily on week days.
Initial download of the metrics may take a while.