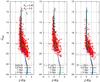
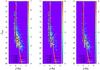
Fig. 6
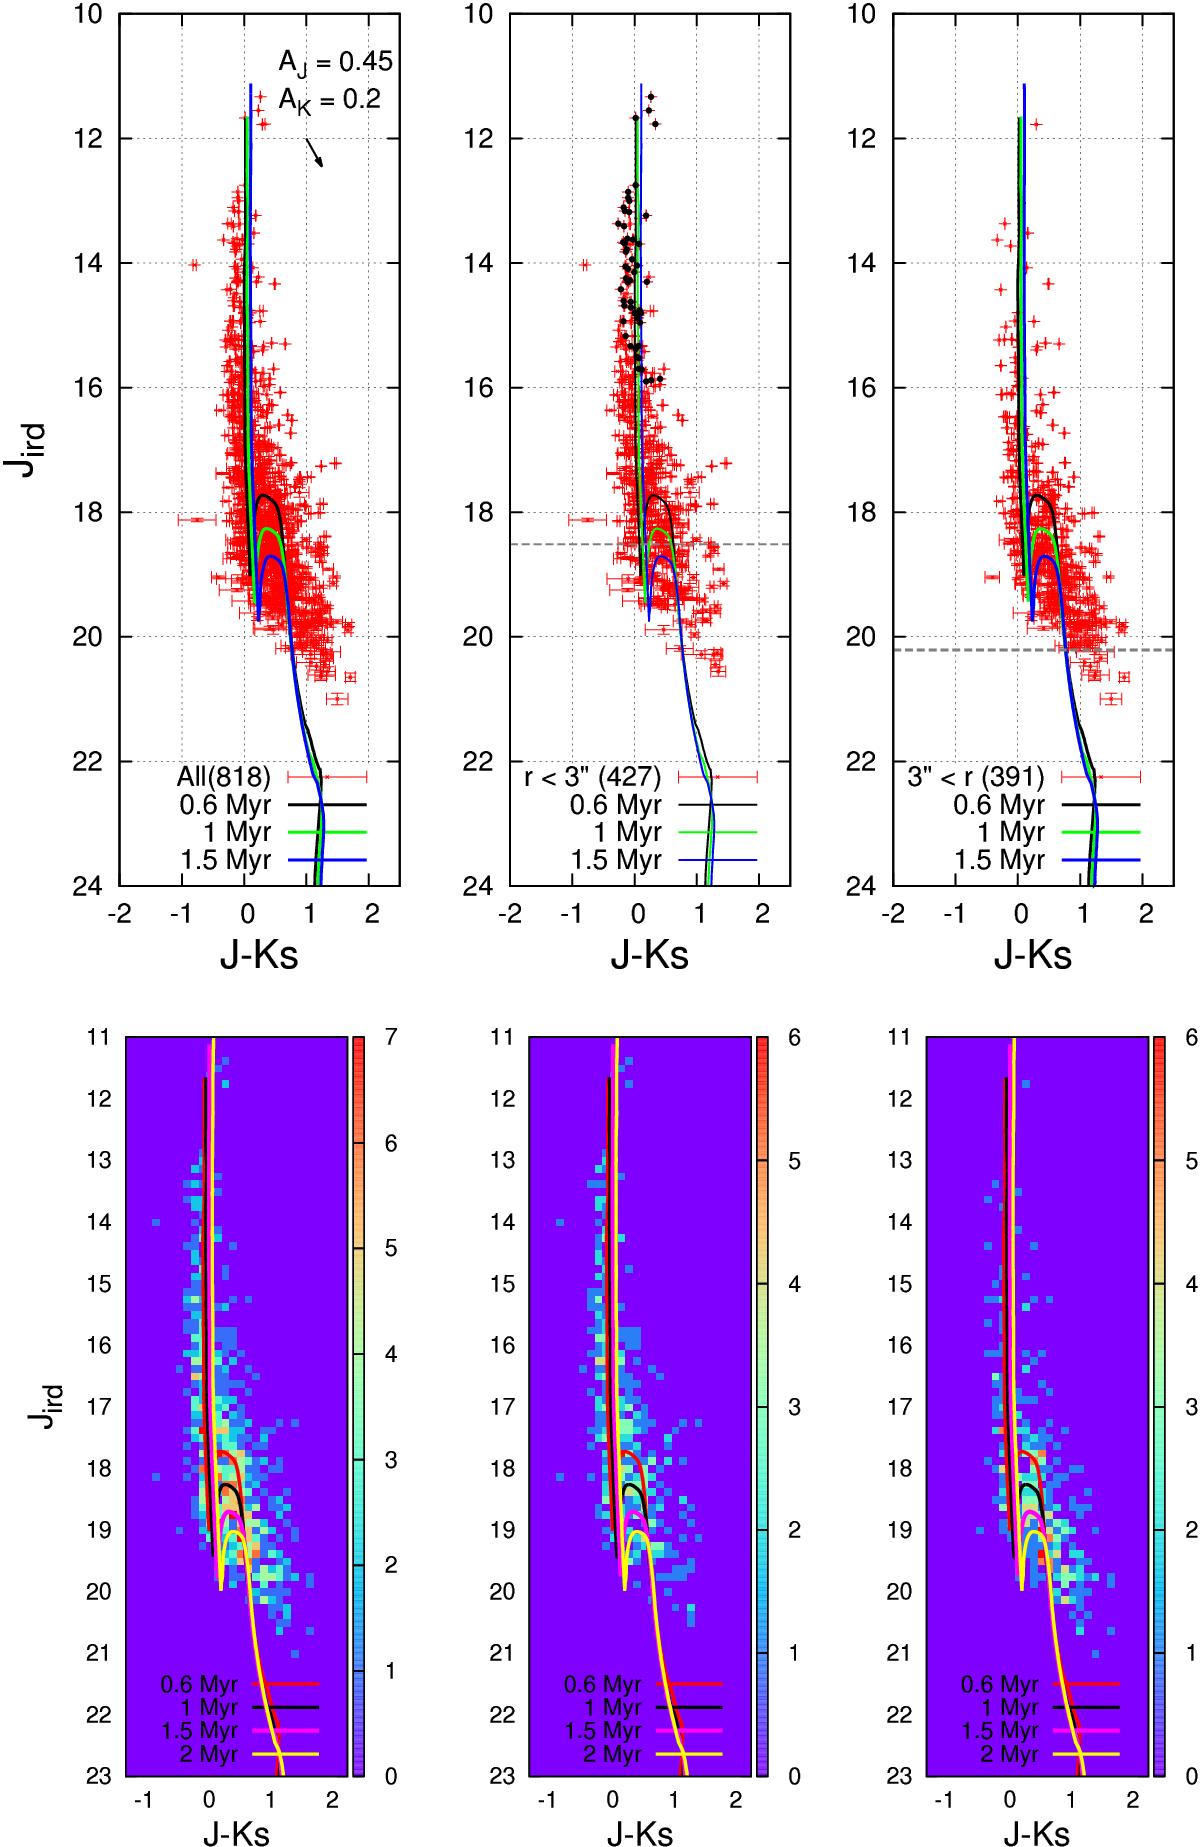
Top: CMD of 818 detected sources in J- and Ks-band images of SPHERE/IRDIS from the core of R 136. Solid black, green and blue lines show the PARSEC isochrones at the ages of 0.6, 1 and 1.5 Myr (corrected for distance modulus of 18.49 and central values of extinctions, AJ = 0.45 mag and AK = 0.2 mag). The horizontal dashed gray line depicts the incompleteness of 70%. The CMD is plotted for the whole FoV (818 sources), in the very core of the cluster (r < 3″) and outside (r > 3″), from left to right respectively. The error bar on each point is the combination of the PSF fitting errors and the residual errors from the background image after removing the stellar source signals from the images. The 54 spectroscopically studied stars by Crowther et al. (2016) are shown as black dots in the middle plot. Bottom: same as top CMD, but in 3D to show the number density of stars in the CMD. Solid red, black, pink, and yellow lines depict PARSEC isochrones at the age of 0.5, 1, 1.5, and 2 Myr, respectively.
Current usage metrics show cumulative count of Article Views (full-text article views including HTML views, PDF and ePub downloads, according to the available data) and Abstracts Views on Vision4Press platform.
Data correspond to usage on the plateform after 2015. The current usage metrics is available 48-96 hours after online publication and is updated daily on week days.
Initial download of the metrics may take a while.