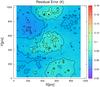
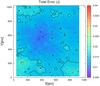
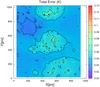
Fig. A.1
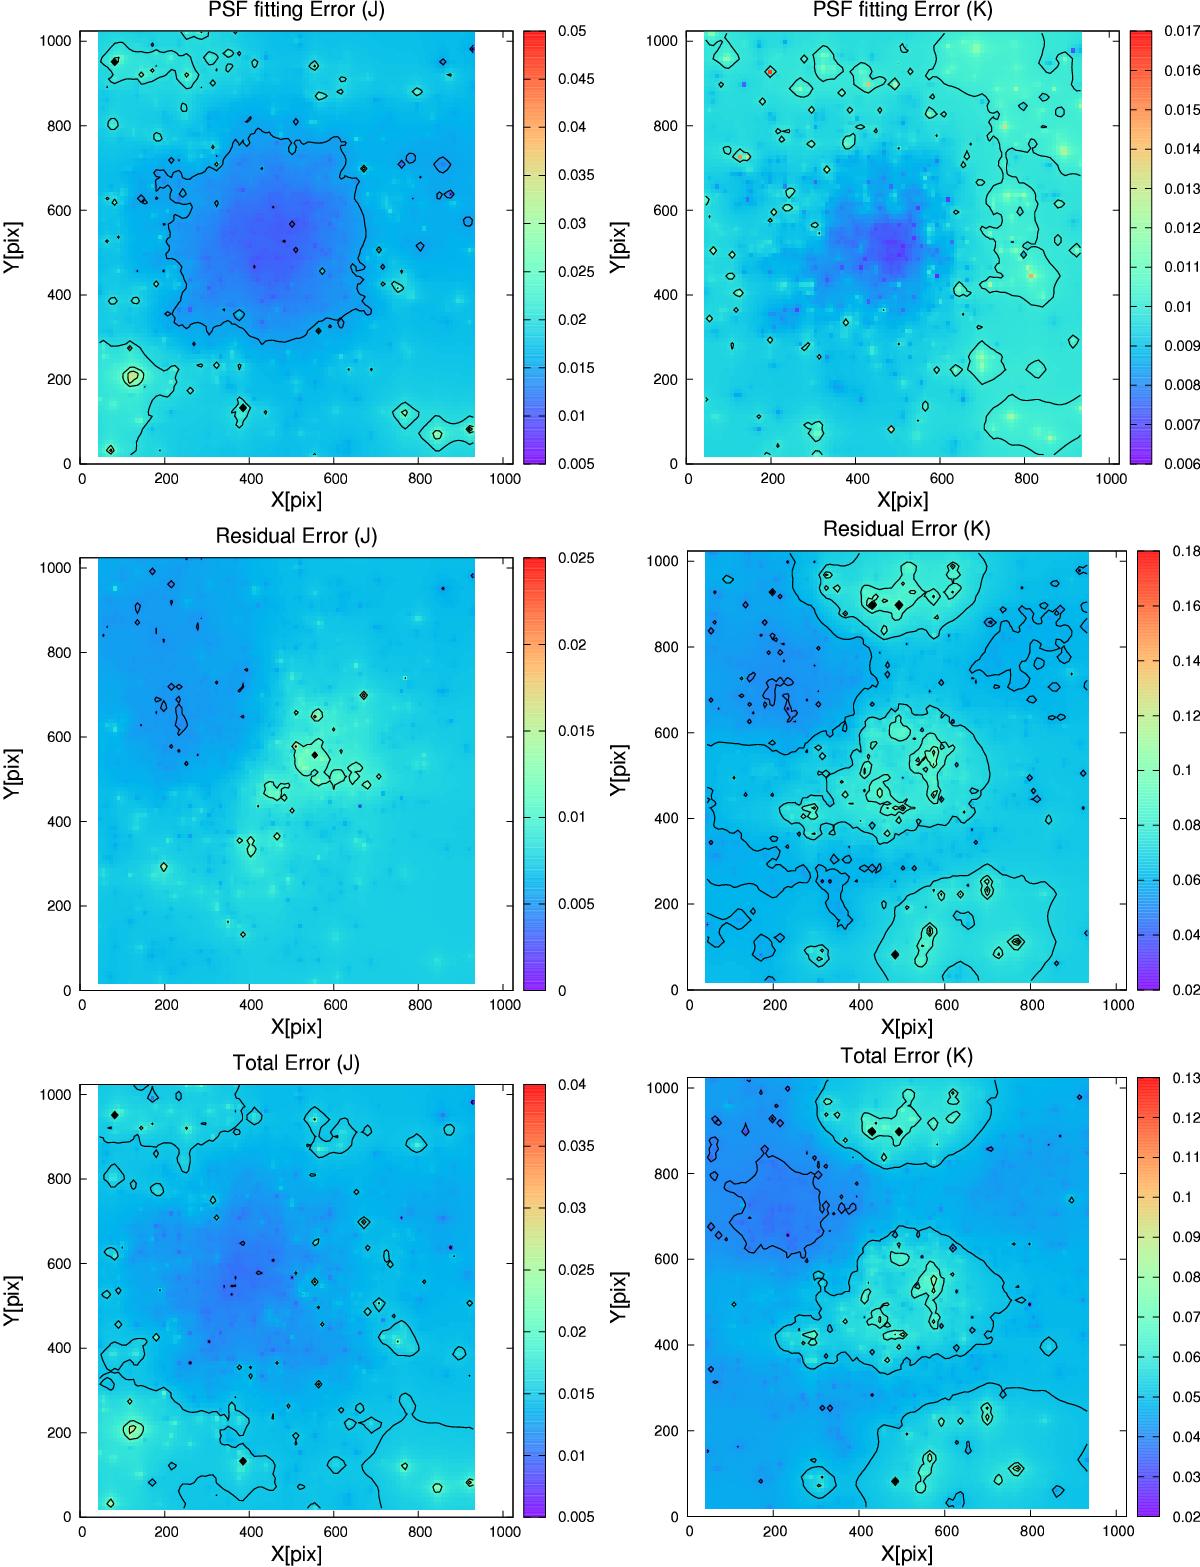
Map of the photometric, residual, and total relative error bars. Top: map of the PSF fitting errors (outcome pf the Starfinder photometry) along the IRDIS FoV. Middle: map of the residual errors, outcome of the background analysis after removing the stellar source signals from the image. Bottom: map of the total relative error, combination of the PSF fitting errors and the residual background errors. Left images are in the J band. Right: images are in the Ks band.
Current usage metrics show cumulative count of Article Views (full-text article views including HTML views, PDF and ePub downloads, according to the available data) and Abstracts Views on Vision4Press platform.
Data correspond to usage on the plateform after 2015. The current usage metrics is available 48-96 hours after online publication and is updated daily on week days.
Initial download of the metrics may take a while.