Fig. 9
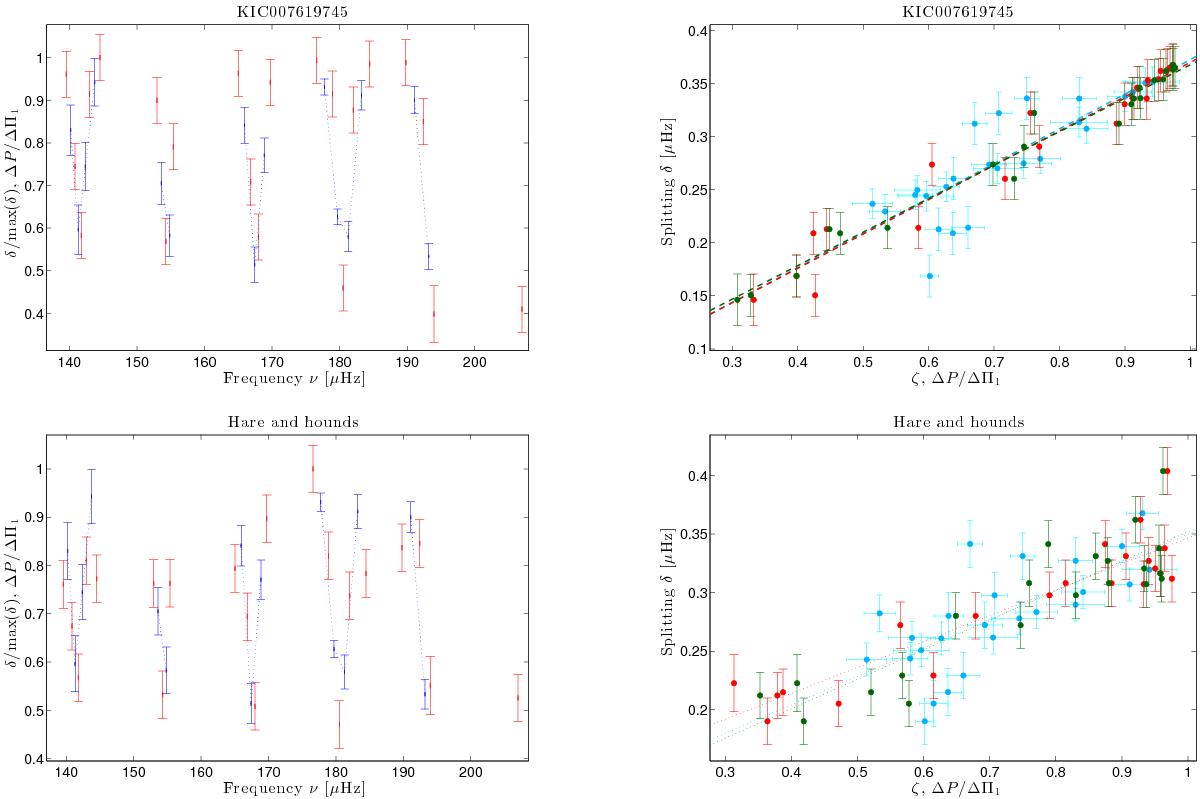
Left column plots show the observed rotational splittings, normalized by their maximum value (red error bars) and the observed period spacings, normalized by the observed period spacing ΔΠ1 (blue error bars) as functions of mode frequency for the target KIC 007619745 (top), and for the hare-and-hounds exercise. Right column plots show the observed rotational splitting δ as a function of ζmod (red points and error bars), δ vs. ζas (dark green points and error bars), and both δ vs. ΔPν/ ΔΠ1 and δΔP vs. ΔP/ ΔΠ1 (blue points and cyan error bars). See Sect. 2.1.
Current usage metrics show cumulative count of Article Views (full-text article views including HTML views, PDF and ePub downloads, according to the available data) and Abstracts Views on Vision4Press platform.
Data correspond to usage on the plateform after 2015. The current usage metrics is available 48-96 hours after online publication and is updated daily on week days.
Initial download of the metrics may take a while.