Fig. 8
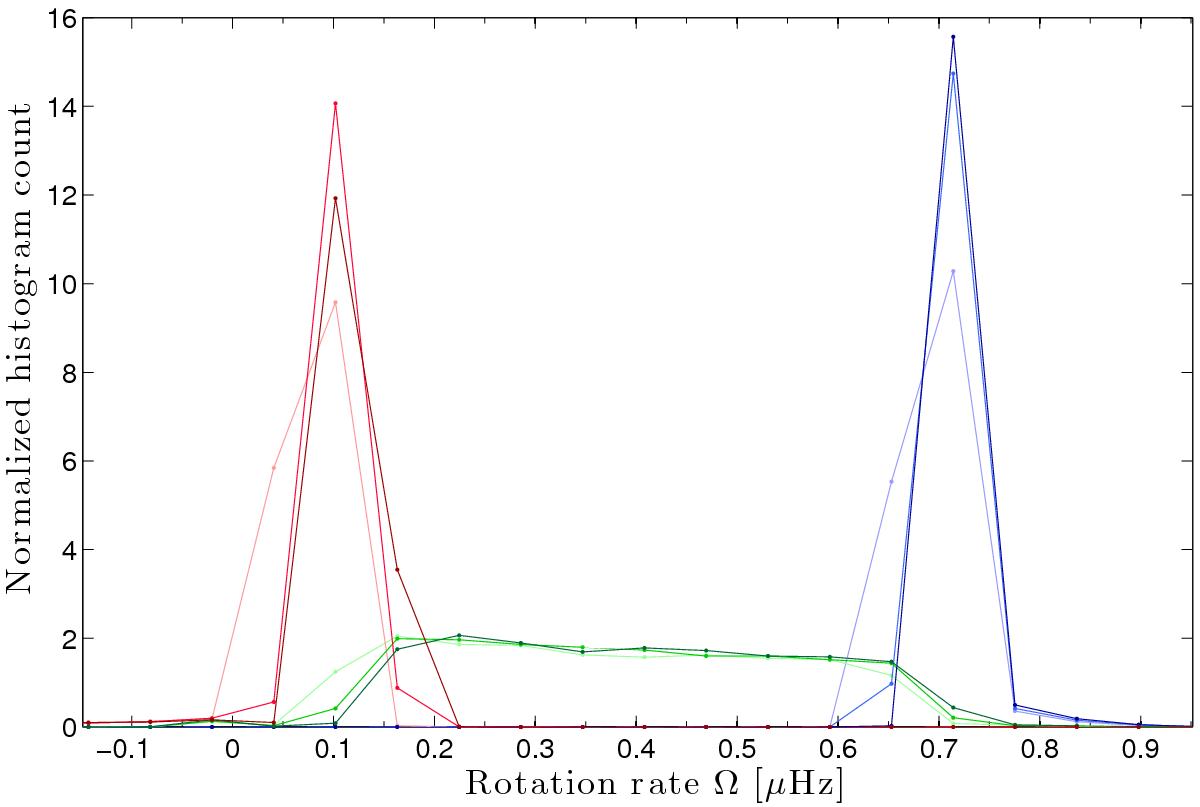
Histogram associated with the predictions for ![]() (blue, green, and red tones, respectively). The true (test) profile is described by Eq. (24)with fixed Ωc = 0.7 μHz, Ωe = 0.1 μHz. The light colors represent the histogram obtained when Ωm = 0.1 μHz, medium colors correspond to Ωm = 0.4 μHz, and dark colors represent Ωm = 0.7 μHz. Essentially identical distributions for
(blue, green, and red tones, respectively). The true (test) profile is described by Eq. (24)with fixed Ωc = 0.7 μHz, Ωe = 0.1 μHz. The light colors represent the histogram obtained when Ωm = 0.1 μHz, medium colors correspond to Ωm = 0.4 μHz, and dark colors represent Ωm = 0.7 μHz. Essentially identical distributions for ![]() result, regardless of the choice of Ωm. While Ωc and Ωe are recovered properly, no good prediction for Ωm can be made.
result, regardless of the choice of Ωm. While Ωc and Ωe are recovered properly, no good prediction for Ωm can be made.
Current usage metrics show cumulative count of Article Views (full-text article views including HTML views, PDF and ePub downloads, according to the available data) and Abstracts Views on Vision4Press platform.
Data correspond to usage on the plateform after 2015. The current usage metrics is available 48-96 hours after online publication and is updated daily on week days.
Initial download of the metrics may take a while.