Fig. 7
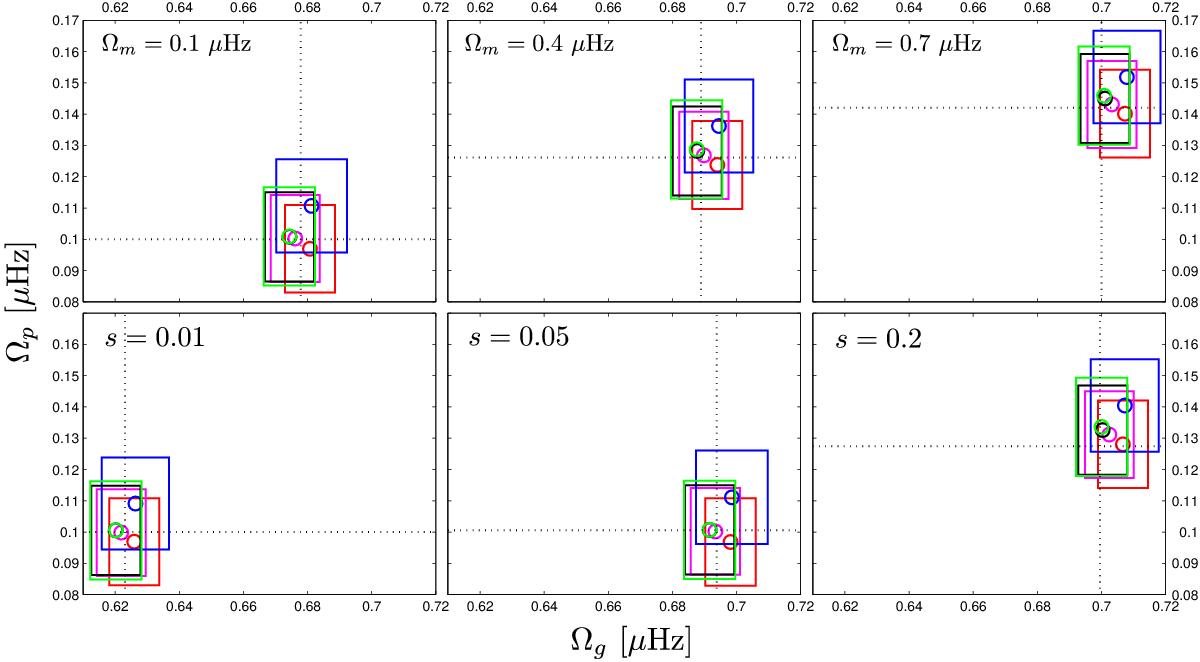
Comparison of the predicted rotation rate averages in the core (Ωg) and in the envelope (Ωp) using the methods described in Sects. 2 and 3 based on the best seismic model for KIC 007619745. The top row corresponds to rotation profiles following Eq. (24), and the bottom row corresponds to Gaussian rotation profiles according to Eq. (26). The black dashed lines mark the true averaged rotation rates as computed from Eqs. (4)and (5). Red represents the rotation rates as determined from linear fits of (ζmod,δ), and magenta represents the rotation rates from linear fits of (ζas,δ). Blue corresponds to linear fits of δ and δΔP vs. ΔPν/ ΔΠ1 and ΔP/ ΔΠ1. Black are the predictions from two-zone inversions, and green are the predictions from SOLA inversions. Results from Bayesian inference are not included here as they are essentially identical to the two-zone models.
Current usage metrics show cumulative count of Article Views (full-text article views including HTML views, PDF and ePub downloads, according to the available data) and Abstracts Views on Vision4Press platform.
Data correspond to usage on the plateform after 2015. The current usage metrics is available 48-96 hours after online publication and is updated daily on week days.
Initial download of the metrics may take a while.