Fig. 6
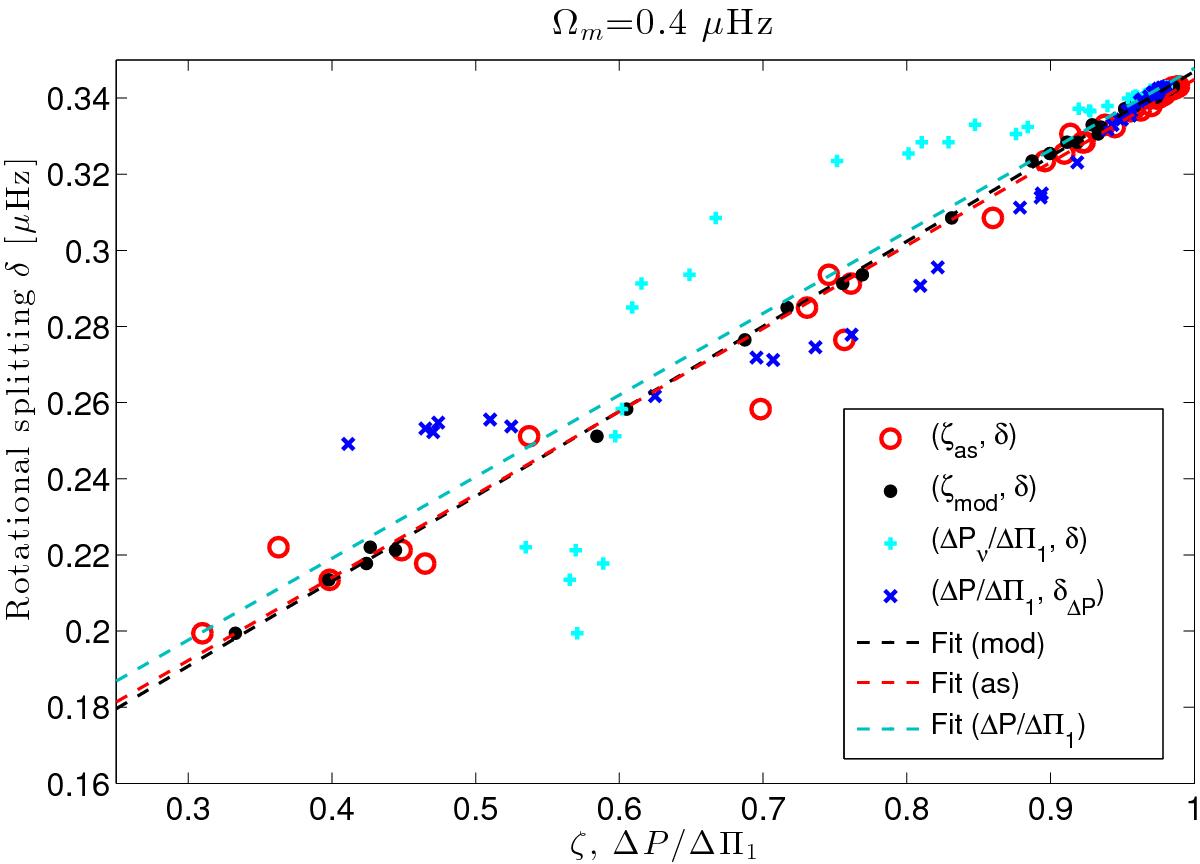
Rotational splittings using the best seismic model of KIC 007619745 for one of the test profiles as defined in Eq. (24)with Ωc = 0.7 μHz, Ωm = 0.4 μHz, and Ωe = 0.1 μHz. The splittings δΔP (dark blue crosses) are the interpolated splittings as explained in Sect. 2.1. Dotted lines are linear fits providing estimates of the rotation rate averages in the g and p cavities following Eq. (3).
Current usage metrics show cumulative count of Article Views (full-text article views including HTML views, PDF and ePub downloads, according to the available data) and Abstracts Views on Vision4Press platform.
Data correspond to usage on the plateform after 2015. The current usage metrics is available 48-96 hours after online publication and is updated daily on week days.
Initial download of the metrics may take a while.