Fig. 4
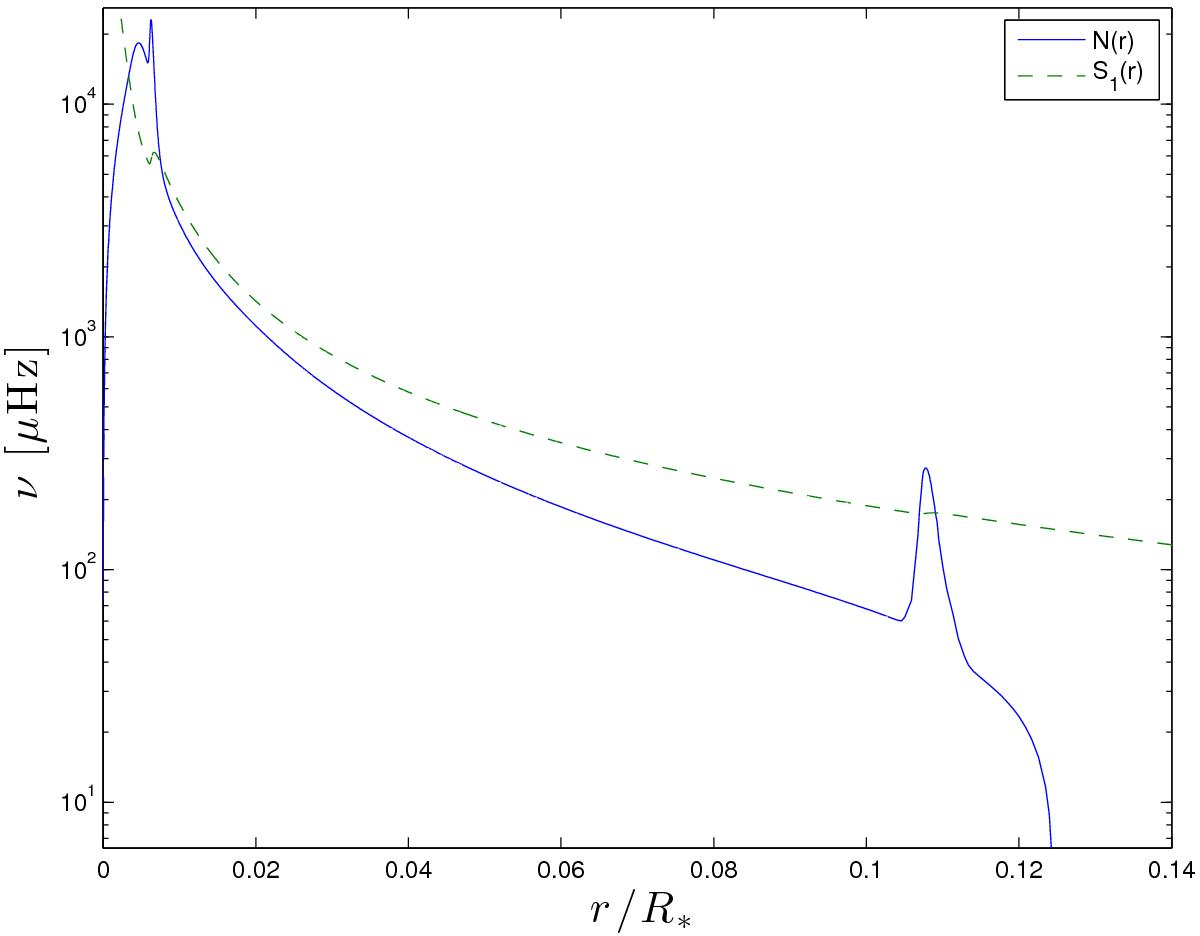
Propagation diagram of the best model of KIC 007619745. The Brunt-Väisälä frequency N(r) is plotted as a solid blue curve, and the l = 1 Lamb frequency S1(r) is plotted as a dashed green curve. p-modes with frequency ν are evanescent in the region where ν < S1(r). Similarly, g-modes are evanescent wherever ν >N(r). The core-envelope boundary in our two-zone models is located at rc ≈ 0.1R∗, which usually lies in the evanescent zone common to both p- and g-modes. The peak of N(r) near r/R∗ = 0.11 is associated with a chemically inhomogeneous layer in the radiative zone, left behind by convection as the boundary moves upward.
Current usage metrics show cumulative count of Article Views (full-text article views including HTML views, PDF and ePub downloads, according to the available data) and Abstracts Views on Vision4Press platform.
Data correspond to usage on the plateform after 2015. The current usage metrics is available 48-96 hours after online publication and is updated daily on week days.
Initial download of the metrics may take a while.