Fig. 2
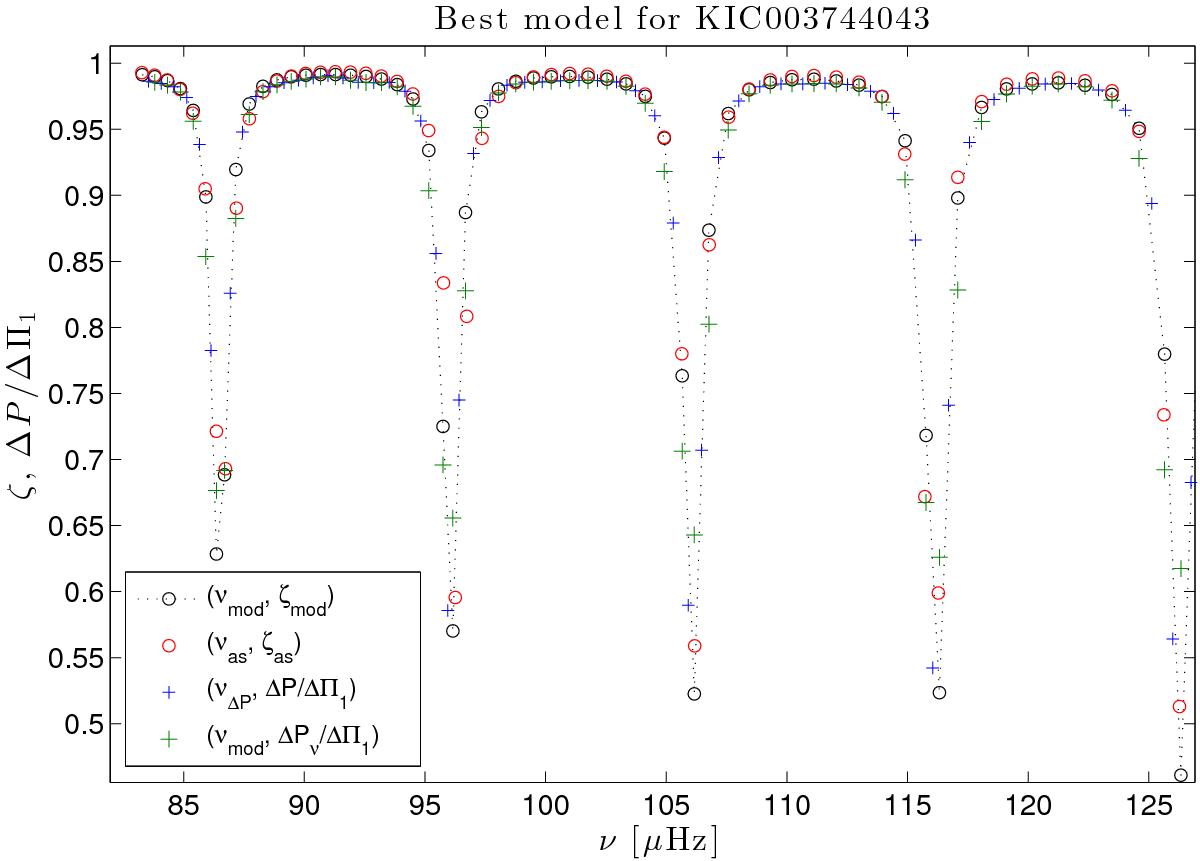
Trapping parameter as described by the true model, ζmod (Eq. (2)) as a function of the true frequencies νmod (dashed black line and black circles). Red circles represent the trapping parameter ζas as approximated by Eqs. (11)and (8)and using νas for the mode frequencies as determined by Eq. (6). The scaled period spacing ΔP/ ΔΠ1 between any two consecutive true frequencies νmod,1 and νmod,2 is plotted at the abscissa ![]() (blue crosses). ΔPν represent the interpolated value of the two adjacent period spacings around each frequency νmod (green crosses).
(blue crosses). ΔPν represent the interpolated value of the two adjacent period spacings around each frequency νmod (green crosses).
Current usage metrics show cumulative count of Article Views (full-text article views including HTML views, PDF and ePub downloads, according to the available data) and Abstracts Views on Vision4Press platform.
Data correspond to usage on the plateform after 2015. The current usage metrics is available 48-96 hours after online publication and is updated daily on week days.
Initial download of the metrics may take a while.