Fig. 12
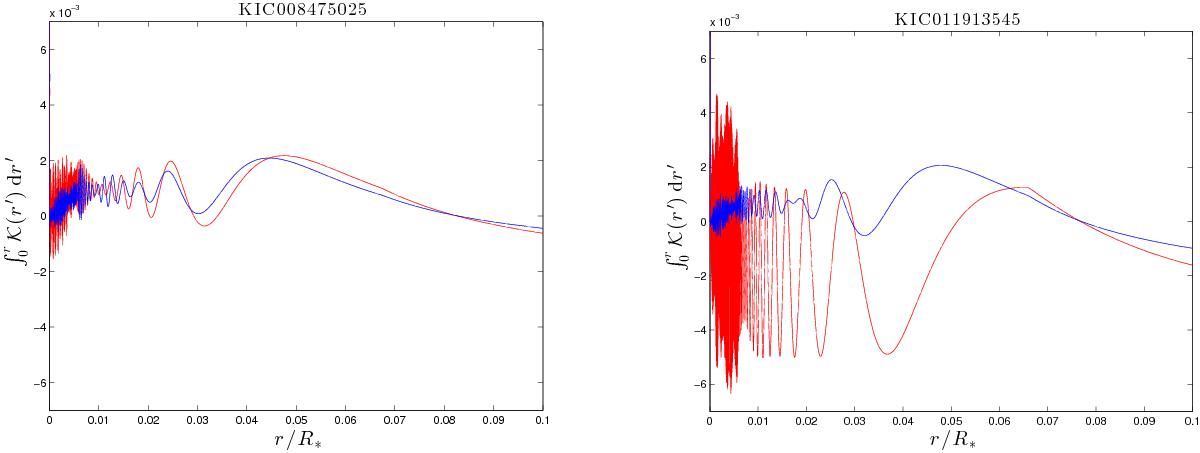
Cumulative integral of averaging kernels ![]() from SOLA inversions at r/R∗ = 1 (blue curves) and the cumulative integral from the outer two-zone model kernels (red curves). The left panel shows the case of KIC 008475025, where both cumulative integrals mostly coincide, are close to zero, and lead to similar average rotation rates of the envelope without appreciable leakage from central regions. In the case of KIC 011913545 (right panel) we see a difference between the cumulative integrals, particularly, the red curve is consistently below zero in the core region, which leads to leakage from these regions affecting the envelope averages.
from SOLA inversions at r/R∗ = 1 (blue curves) and the cumulative integral from the outer two-zone model kernels (red curves). The left panel shows the case of KIC 008475025, where both cumulative integrals mostly coincide, are close to zero, and lead to similar average rotation rates of the envelope without appreciable leakage from central regions. In the case of KIC 011913545 (right panel) we see a difference between the cumulative integrals, particularly, the red curve is consistently below zero in the core region, which leads to leakage from these regions affecting the envelope averages.
Current usage metrics show cumulative count of Article Views (full-text article views including HTML views, PDF and ePub downloads, according to the available data) and Abstracts Views on Vision4Press platform.
Data correspond to usage on the plateform after 2015. The current usage metrics is available 48-96 hours after online publication and is updated daily on week days.
Initial download of the metrics may take a while.