Fig. B.1
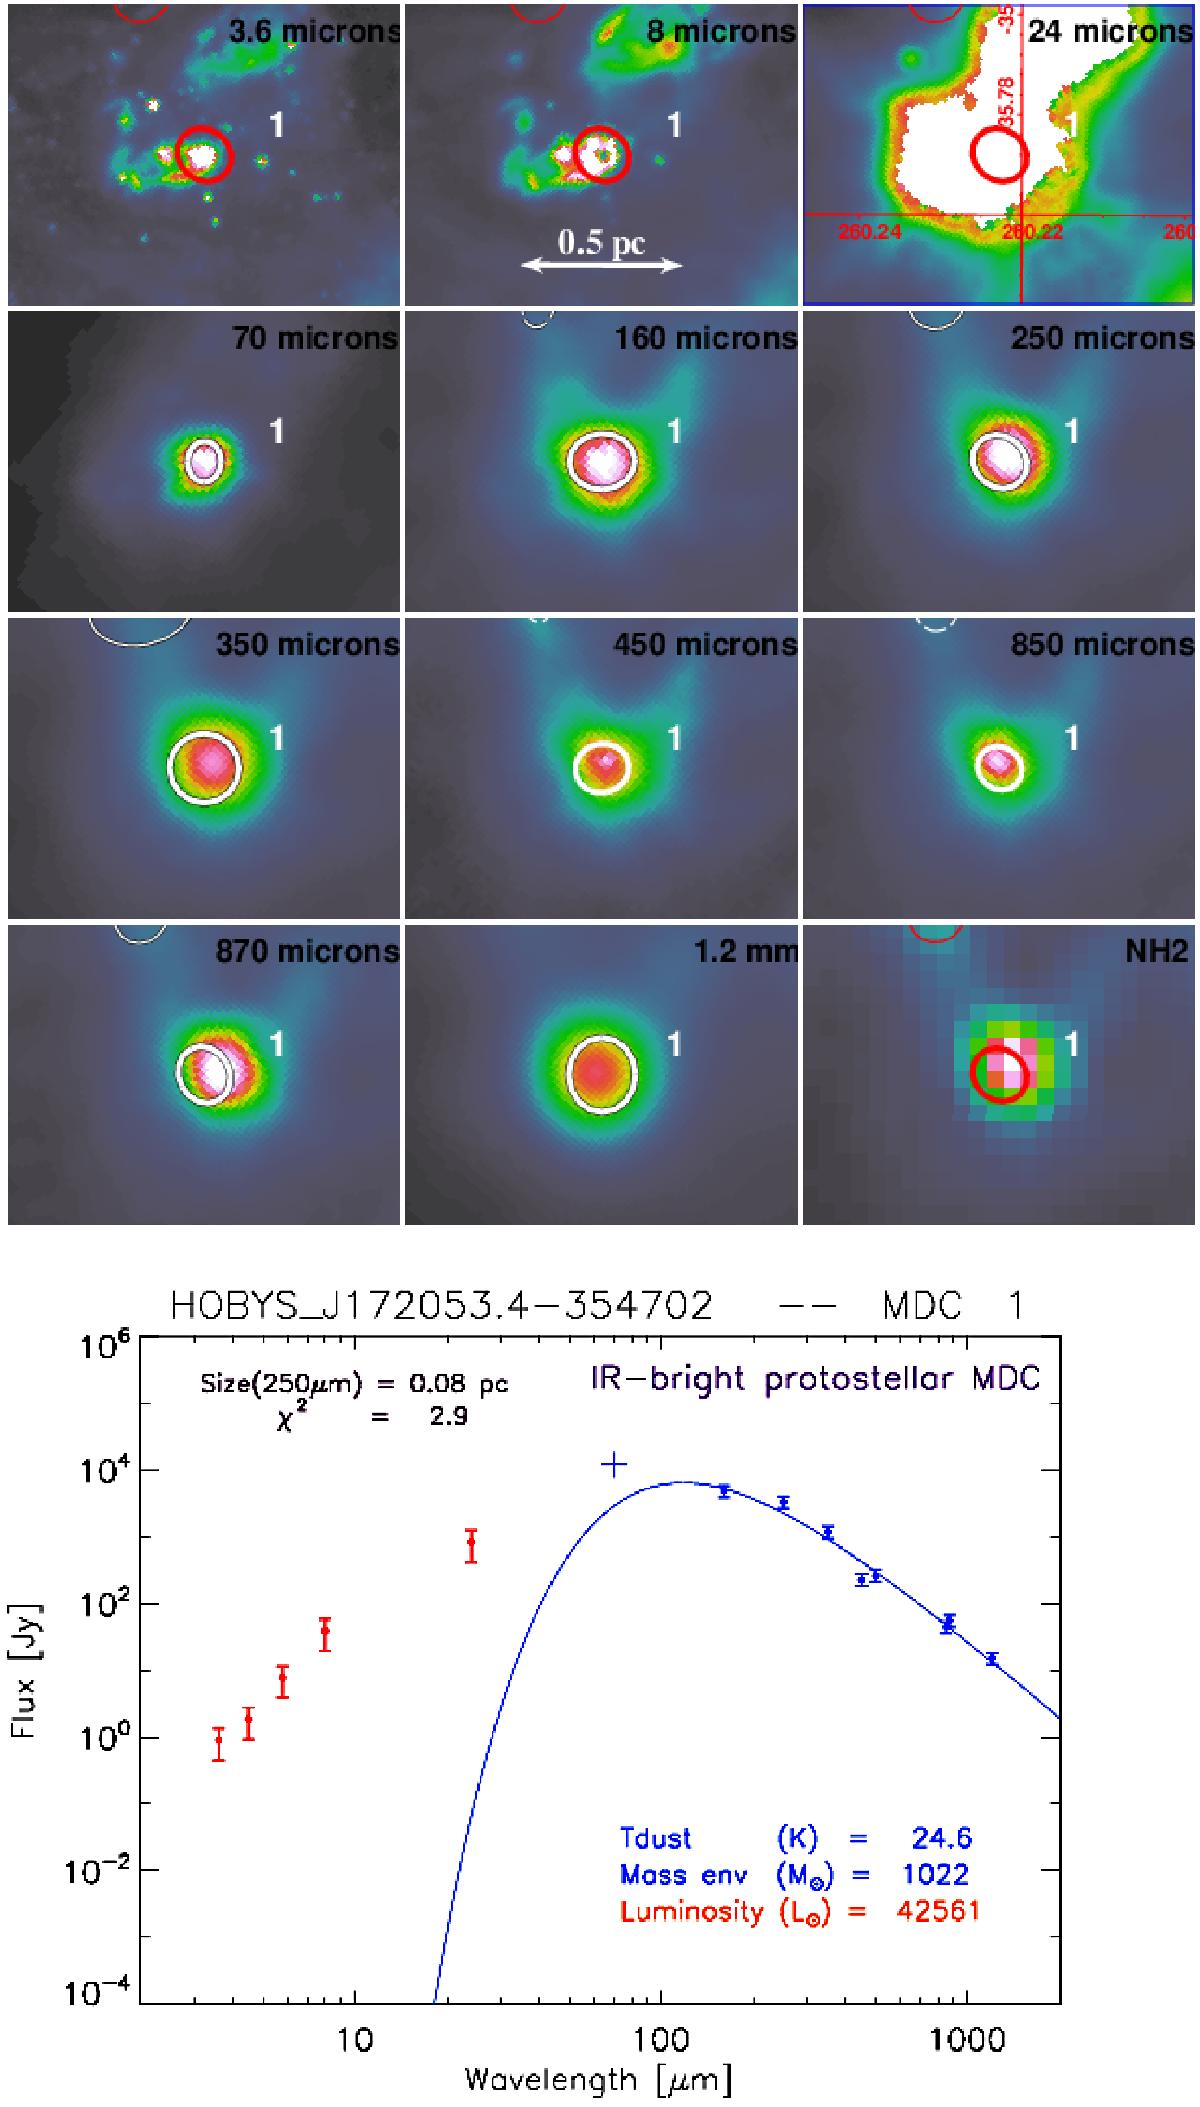
Maps are: 3.6 μm, 8 μm, 24 μm, 70 μm, 160 μm, 250 μm, 350 μm, 450 μm, 500 μm, 850 μm, 870 μm, 1.2 mm and high-resolution NH2 column density. White ellipses represent the getsources FWHM integration size measured for ≥70 μm wavelengths and white numbers are MDC IDs. Red ellipses show the reference FWHM size (at either 160 μm or 250 μm), plotted in <70 μm images or images where source flux is not reliable (see Sect. 3.2). Dashed ellipses outline extracted sources, whose fluxes are used as upper limits in SEDs. Linear color scales are adjusted in each image to highlight sources of interest and their close surroundings. Large white areas observed at 24 μm toward MDCs #1, #6, #7, #10, #22, #23, #25, #32, #38, and #41 correspond to regions of flux saturation with Spitzer (see also Table A.8). SED: flux density versus λ: blue fit and fluxes are for the MDC envelope and red fluxes are associated IR sources. Crosses at 70 μm indicate extracted 70 μm fluxes not used in the fitting procedure.
Current usage metrics show cumulative count of Article Views (full-text article views including HTML views, PDF and ePub downloads, according to the available data) and Abstracts Views on Vision4Press platform.
Data correspond to usage on the plateform after 2015. The current usage metrics is available 48-96 hours after online publication and is updated daily on week days.
Initial download of the metrics may take a while.