Fig. 11
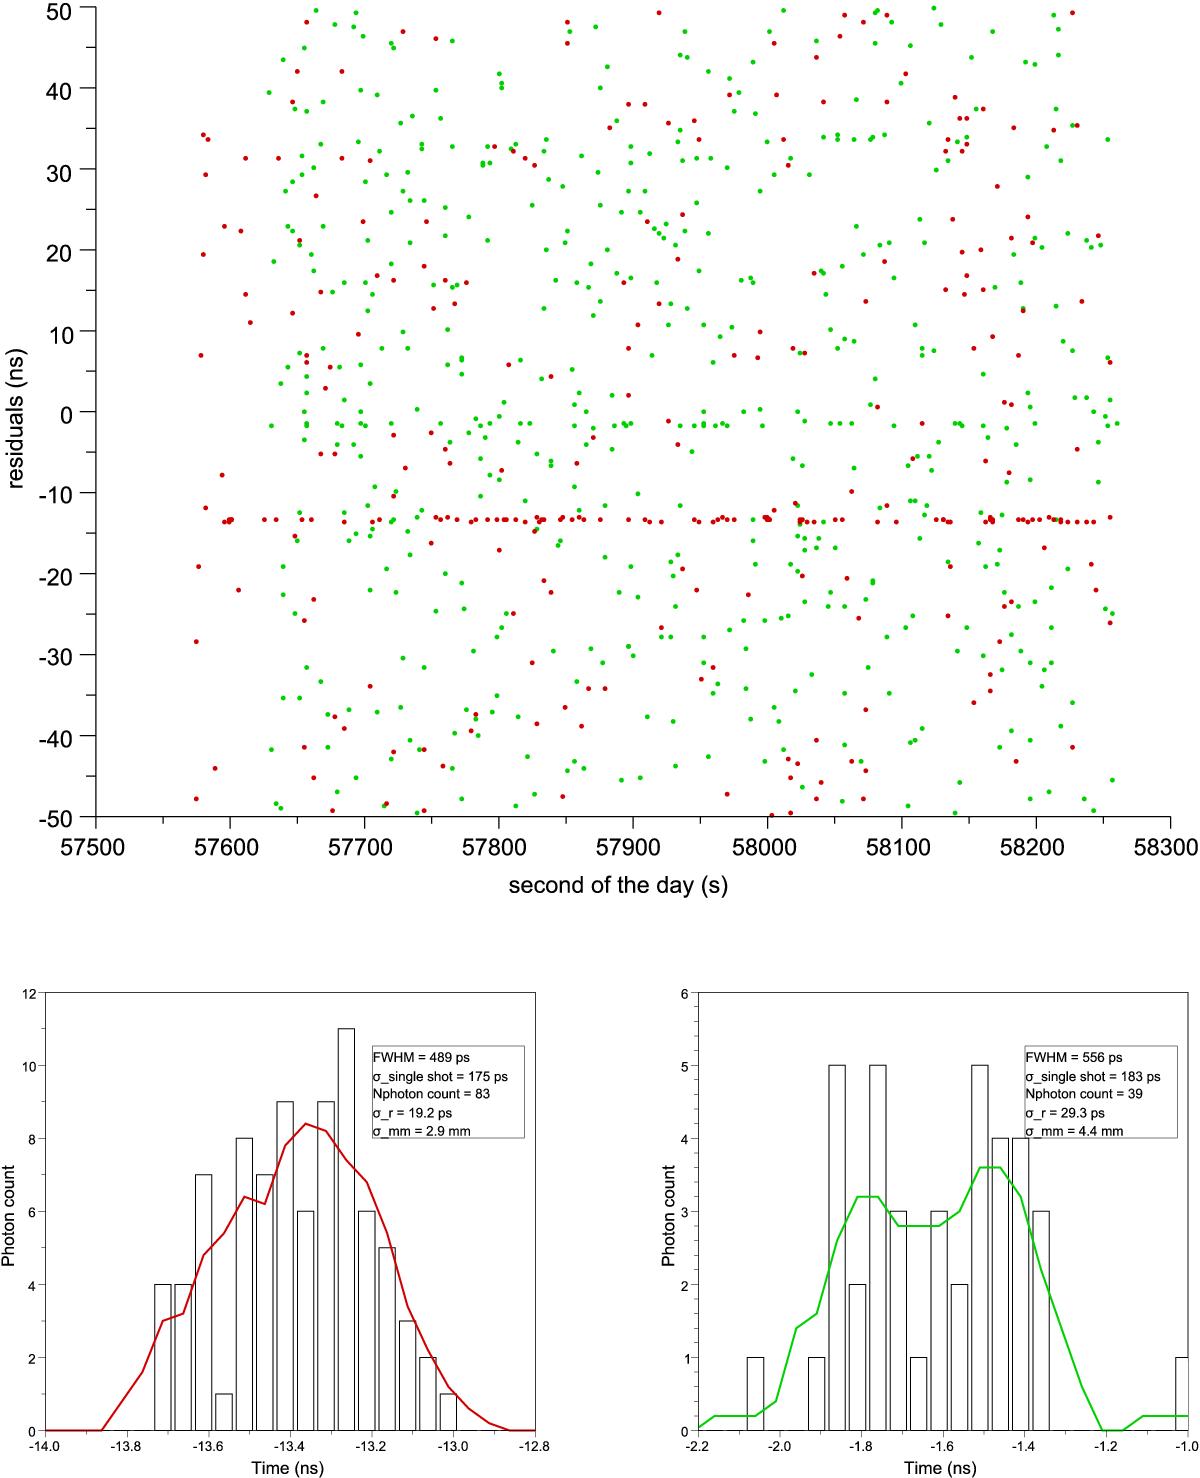
Two-colour LLR measurement on A15, performed on 13 Jan 2016 at 15H59 UTC. The upper part shows the green and IR counts as obtained in realtime. The lunar returns are the two tracks which are clearly separated from the noise. The scale of the residual is arbitrary. The IR counts are offset from the green counts to improve their visibility. The lower part shows the histogram of the IR and green counts. The histograms are created using 50 ps bins. The traces in bold are a five-point moving average. The two peaks present for the green are due to a data-binning effect.
Current usage metrics show cumulative count of Article Views (full-text article views including HTML views, PDF and ePub downloads, according to the available data) and Abstracts Views on Vision4Press platform.
Data correspond to usage on the plateform after 2015. The current usage metrics is available 48-96 hours after online publication and is updated daily on week days.
Initial download of the metrics may take a while.