Fig. 11
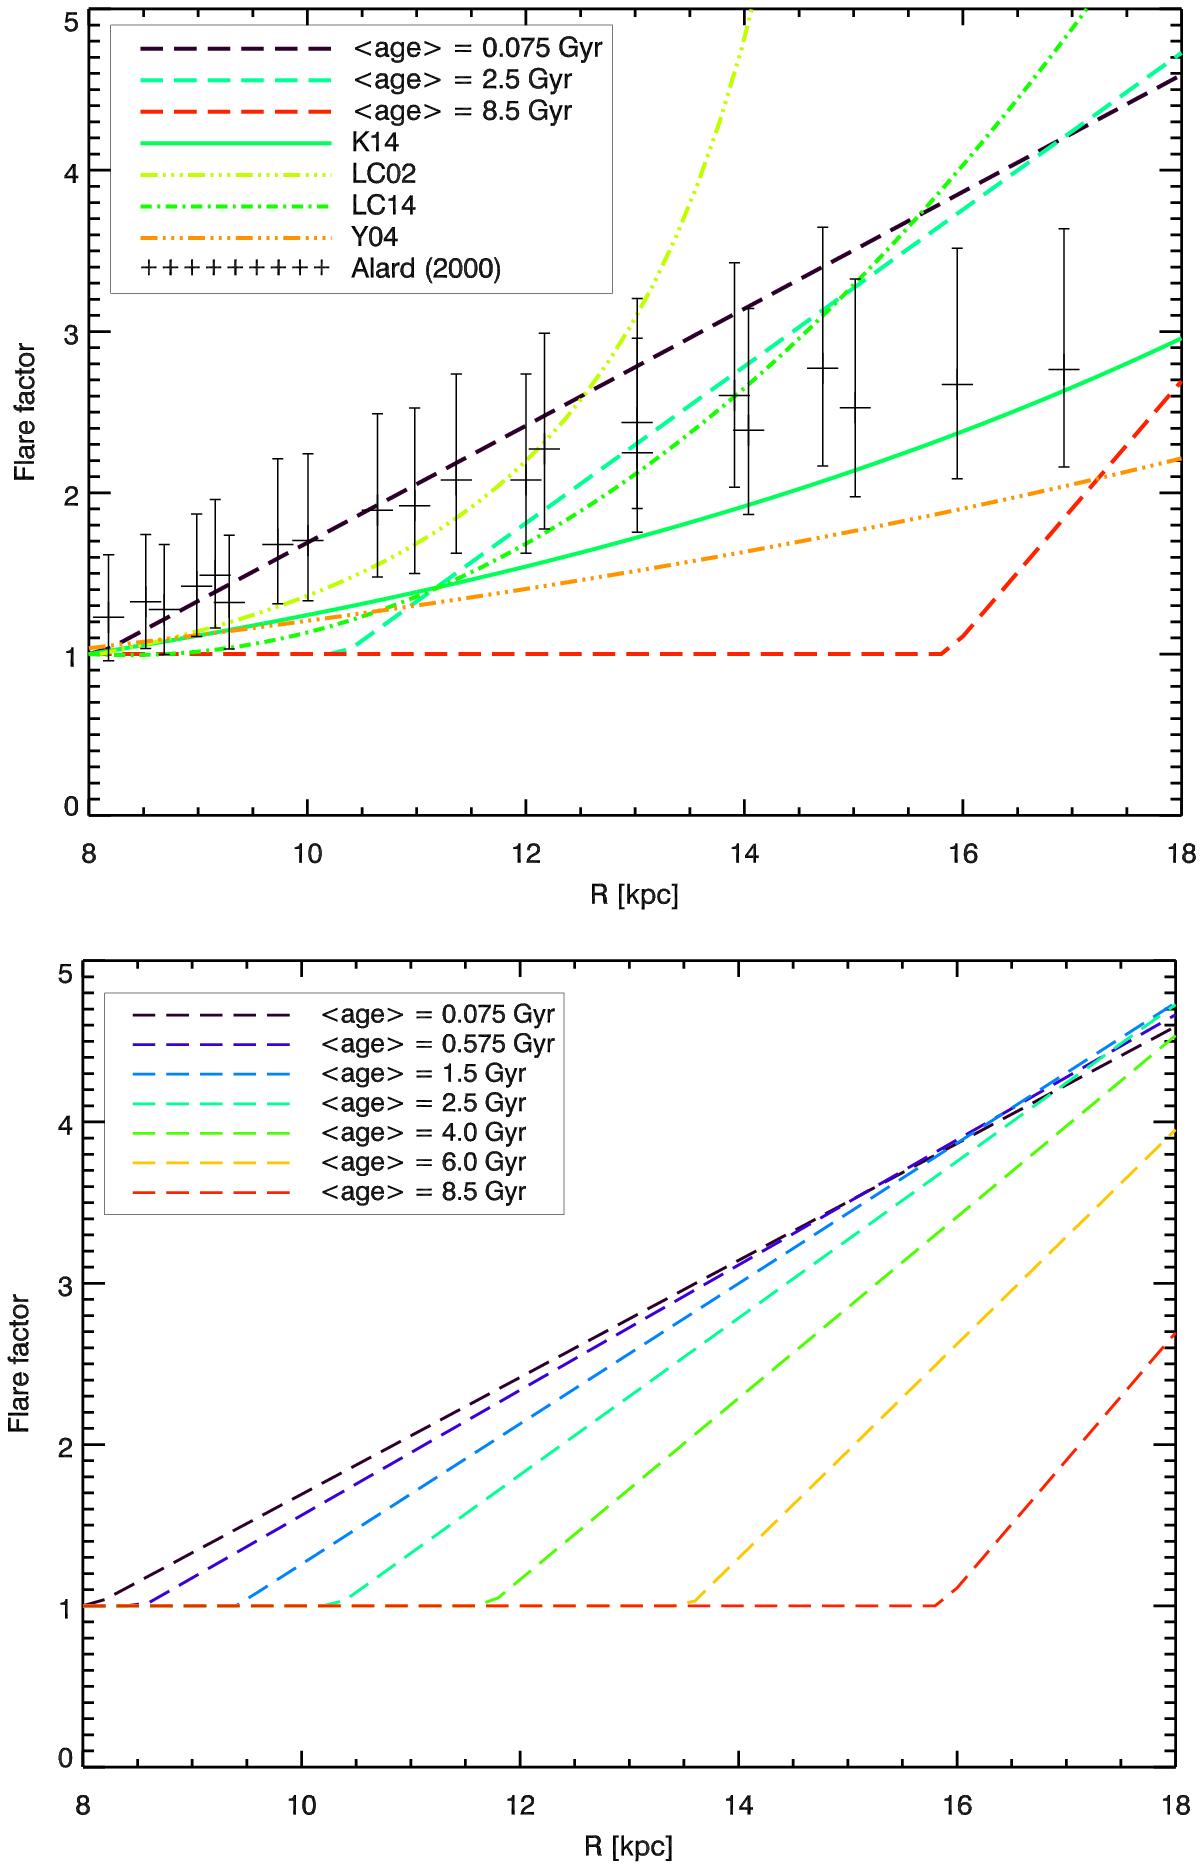
Upper panel: comparison of flare factors (see text for its definition), lines: from López-Corredoira et al. (2002) from red giants (LC02), Yusifov (2004) from pulsars (Y04), Kalberla et al. (2014) from HI gas (K14), López-Corredoira & Molgó (2014) from SDSS-SEGUE data (LC14), and our study (dashed lines). Crosses are the data of Alard (2000) from 2MASS for three ranges of longitudes: ℓ = 66.0°, 180° and 240°. The values of hz(RSun) considered for each author were 0.285, 0.580, 0.200, 0.240 and 0.250 pc, respectively. Lower panel: flare factor for each age class bin in our best fit model from sim-2.
Current usage metrics show cumulative count of Article Views (full-text article views including HTML views, PDF and ePub downloads, according to the available data) and Abstracts Views on Vision4Press platform.
Data correspond to usage on the plateform after 2015. The current usage metrics is available 48-96 hours after online publication and is updated daily on week days.
Initial download of the metrics may take a while.