Fig. 10
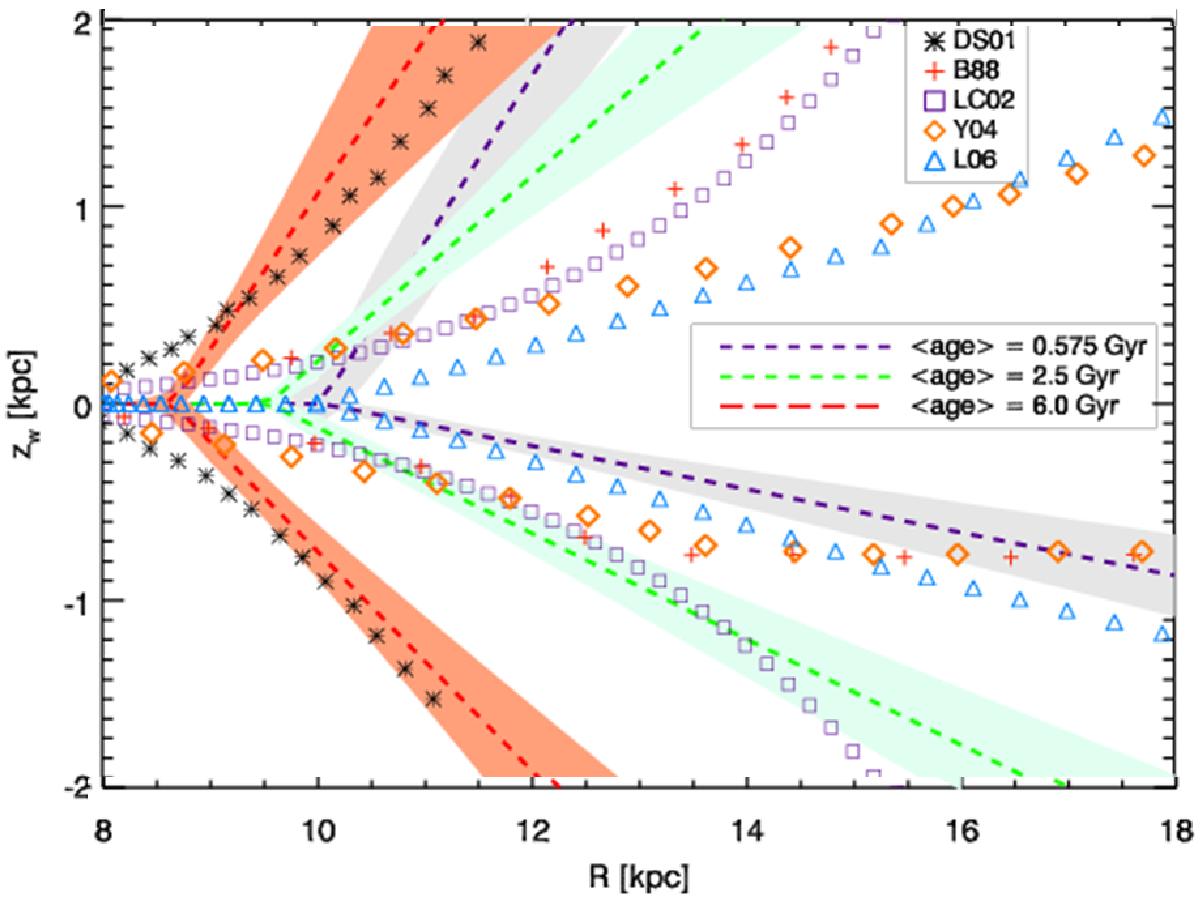
Comparison of the maximum height of the warp as a function of Galactocentric distance obtained in sim-2 for three different mean ages (dashed lines) with other authors (symbols): López-Corredoira et al. (2002) from red giants (LC02: black open squares), Yusifov (2004) from pulsars (Y04: orange diamonds), Burton (1988) from HI gas (B88: orange plus signs), Levine et al. (2006) model fitted on HI (L06: blue open triangles), Drimmel & Spergel (2001) from COBE/DIRBE data (DS01: black asterisks). Positive (resp. negative) values of zw refer to second (resp. third) quadrant.
Current usage metrics show cumulative count of Article Views (full-text article views including HTML views, PDF and ePub downloads, according to the available data) and Abstracts Views on Vision4Press platform.
Data correspond to usage on the plateform after 2015. The current usage metrics is available 48-96 hours after online publication and is updated daily on week days.
Initial download of the metrics may take a while.