Fig. 9
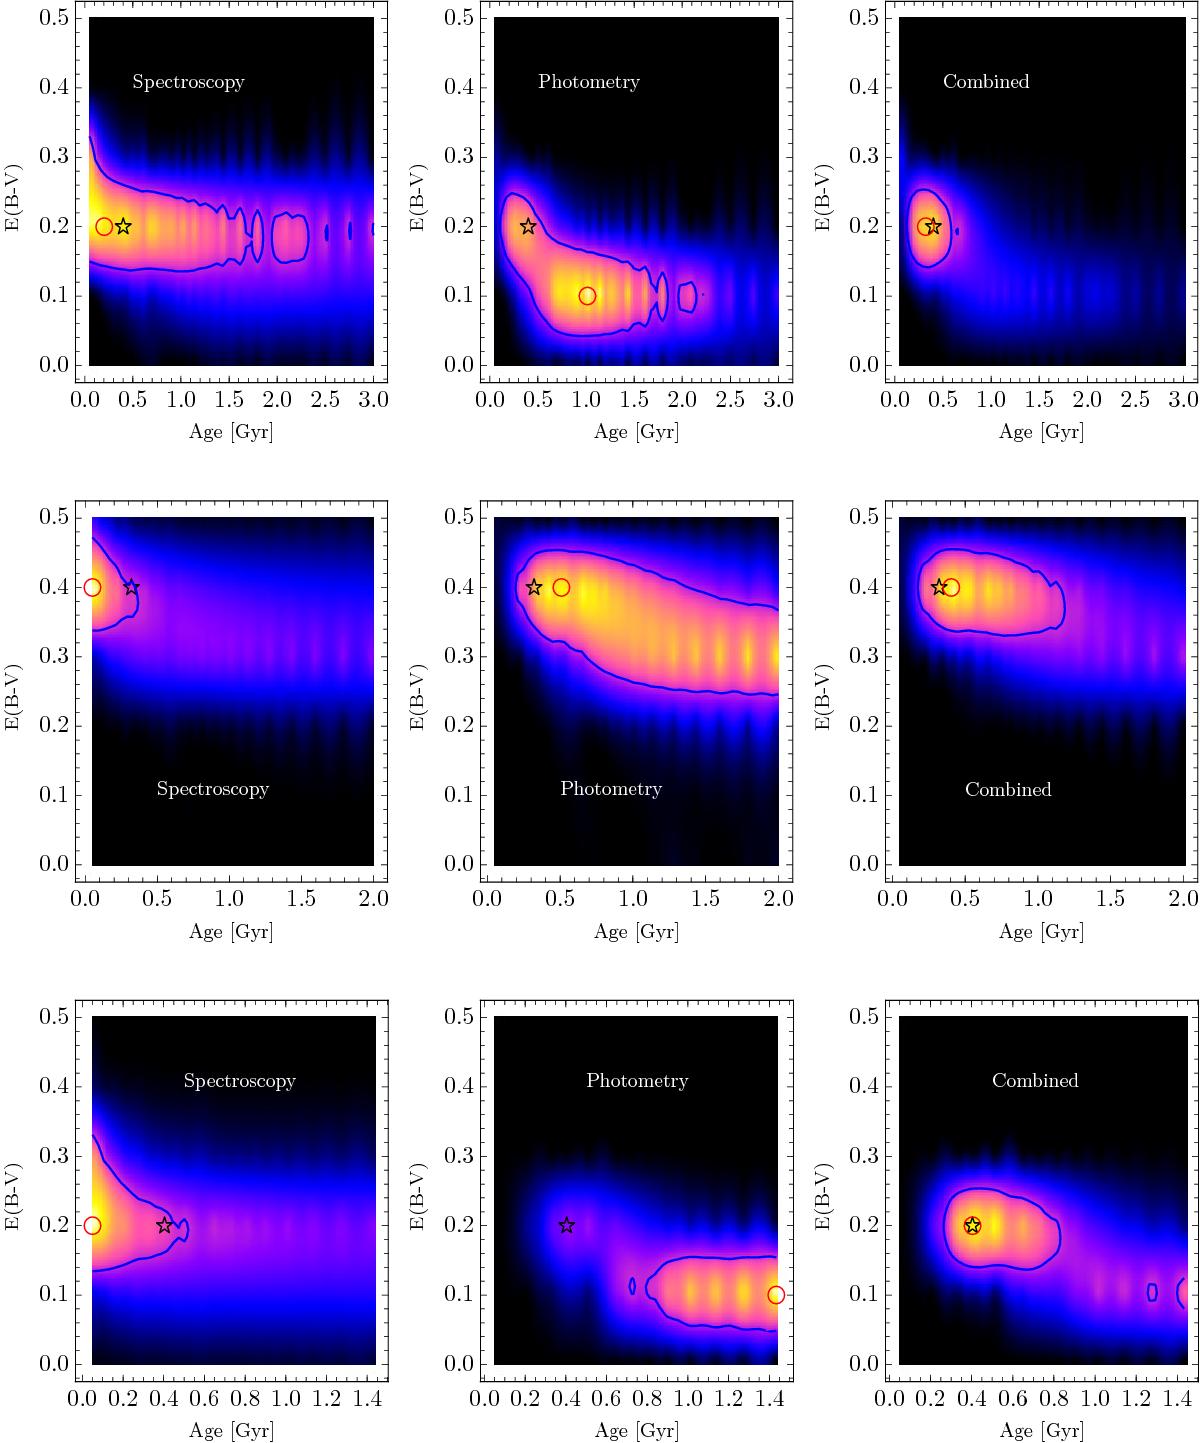
Nine examples of probability density maps in our simulation. From left to right: fitting the photometry only, the spectroscopy only, and the combined fit. From top to bottom: simulated galaxy at z = 2.20 with a dust extinction of 0.2 and age of 0.404 Gyr, simulated galaxy at z = 3.15 with E(B−V) = 0.4 and age = 0.321 Gyr, and a simulated galaxy at z = 4.26, E(B−V) = 0.2 and age = 0.4 Gyr. In each map, the red circle shows the maximum of probability, the 1σ contour is shown by the blue line and the input couple (E(B−V), age) is shown by the black star. The age corresponds to the ![]() definition. In this example, the combined fit is the only fit that is able to reproduce the input values and also the only fit in which the 1σ is the smallest.
definition. In this example, the combined fit is the only fit that is able to reproduce the input values and also the only fit in which the 1σ is the smallest.
Current usage metrics show cumulative count of Article Views (full-text article views including HTML views, PDF and ePub downloads, according to the available data) and Abstracts Views on Vision4Press platform.
Data correspond to usage on the plateform after 2015. The current usage metrics is available 48-96 hours after online publication and is updated daily on week days.
Initial download of the metrics may take a while.