Fig. 23
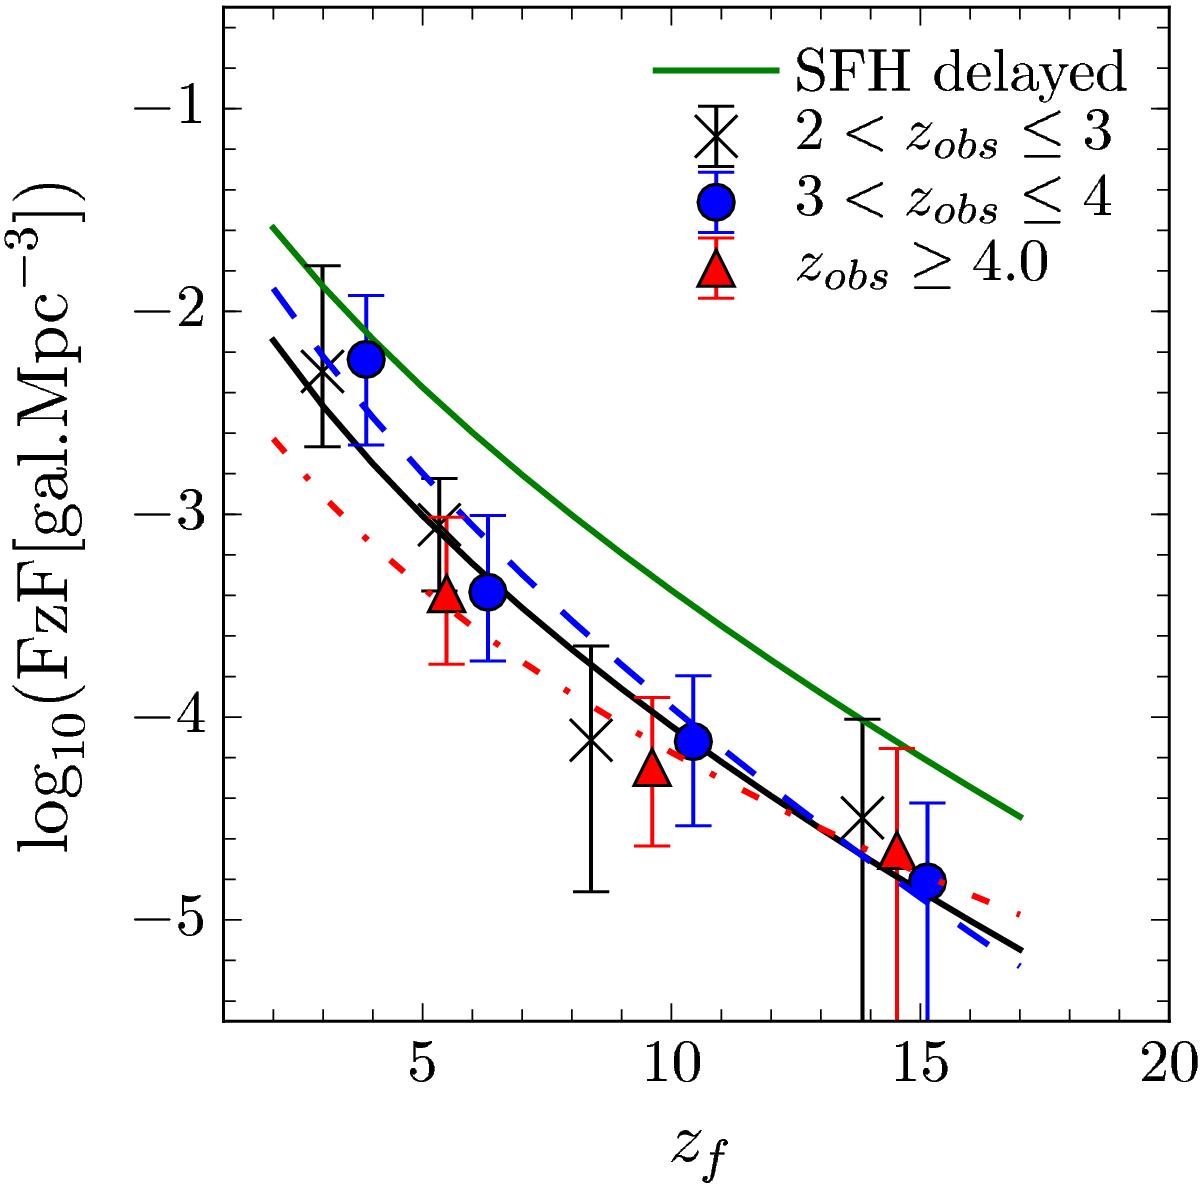
Comparison of the FzFs from different SFHs. In green, global FzF computed from all the points presented in Fig. 22 derived with exponentially delayed SFH. In black, blue, and red, we show the FzFs derived from exponentially delayed SFH as well as their fits in 3 observed redshift bins: 2 <zobs ≤ 3, 3 <zobs ≤ 4, and zobs ≥ 4.0, respectively.
Current usage metrics show cumulative count of Article Views (full-text article views including HTML views, PDF and ePub downloads, according to the available data) and Abstracts Views on Vision4Press platform.
Data correspond to usage on the plateform after 2015. The current usage metrics is available 48-96 hours after online publication and is updated daily on week days.
Initial download of the metrics may take a while.