Fig. 2
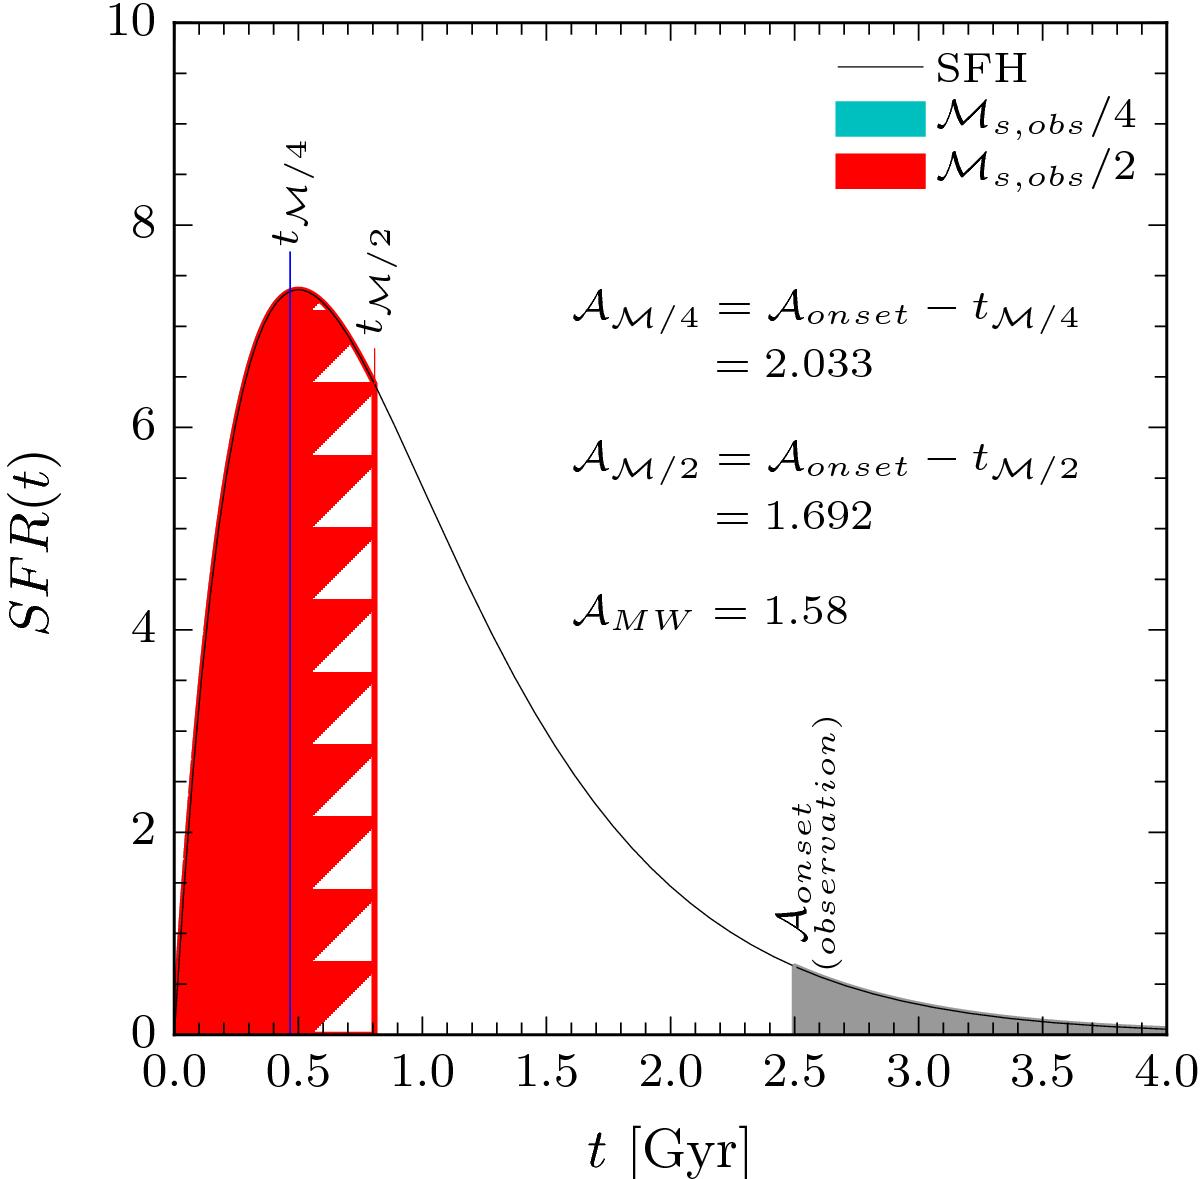
Different age definitions and their relation to stellar mass on an example. The grey line represents the SFH of the galaxy while the grey shaded area is in the future of the observation (the “0” of the x-axis represents the formation of the galaxy). The blue and red areas represent one-quarter and half of the stellar mass, respectively. Finally, tM/ 4 and tM/ 2 show the time since the onset of the star formation and the time to build up 25% and 50% of the stellar mass, respectively. In this example the galaxy is observed 2.5 Gyr after the start of star formation, ![]() Gyr, and the stellar mass is 1010 ℳ⊙. This induces
Gyr, and the stellar mass is 1010 ℳ⊙. This induces ![]() Gyr,
Gyr, ![]() Gyr, and
Gyr, and ![]() Gyr.
Gyr.
Current usage metrics show cumulative count of Article Views (full-text article views including HTML views, PDF and ePub downloads, according to the available data) and Abstracts Views on Vision4Press platform.
Data correspond to usage on the plateform after 2015. The current usage metrics is available 48-96 hours after online publication and is updated daily on week days.
Initial download of the metrics may take a while.