Fig. 15
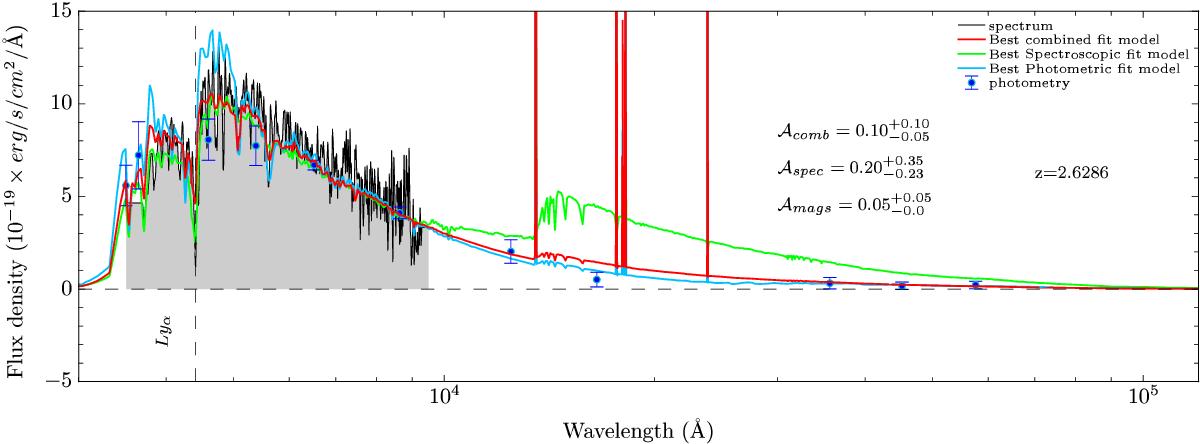
Comparison of the fits from the three types of fitting modes on a galaxy at z = 2.6286. The black line represents the observed spectroscopy and the blue points represent the observed photometry. We show the best fit model of the fit on the photometry, combined data and spectroscopy in light blue, red and green, respectively. The fit on the combined data is only able to reproduce both types of data.
Current usage metrics show cumulative count of Article Views (full-text article views including HTML views, PDF and ePub downloads, according to the available data) and Abstracts Views on Vision4Press platform.
Data correspond to usage on the plateform after 2015. The current usage metrics is available 48-96 hours after online publication and is updated daily on week days.
Initial download of the metrics may take a while.