Free Access
Fig. 13
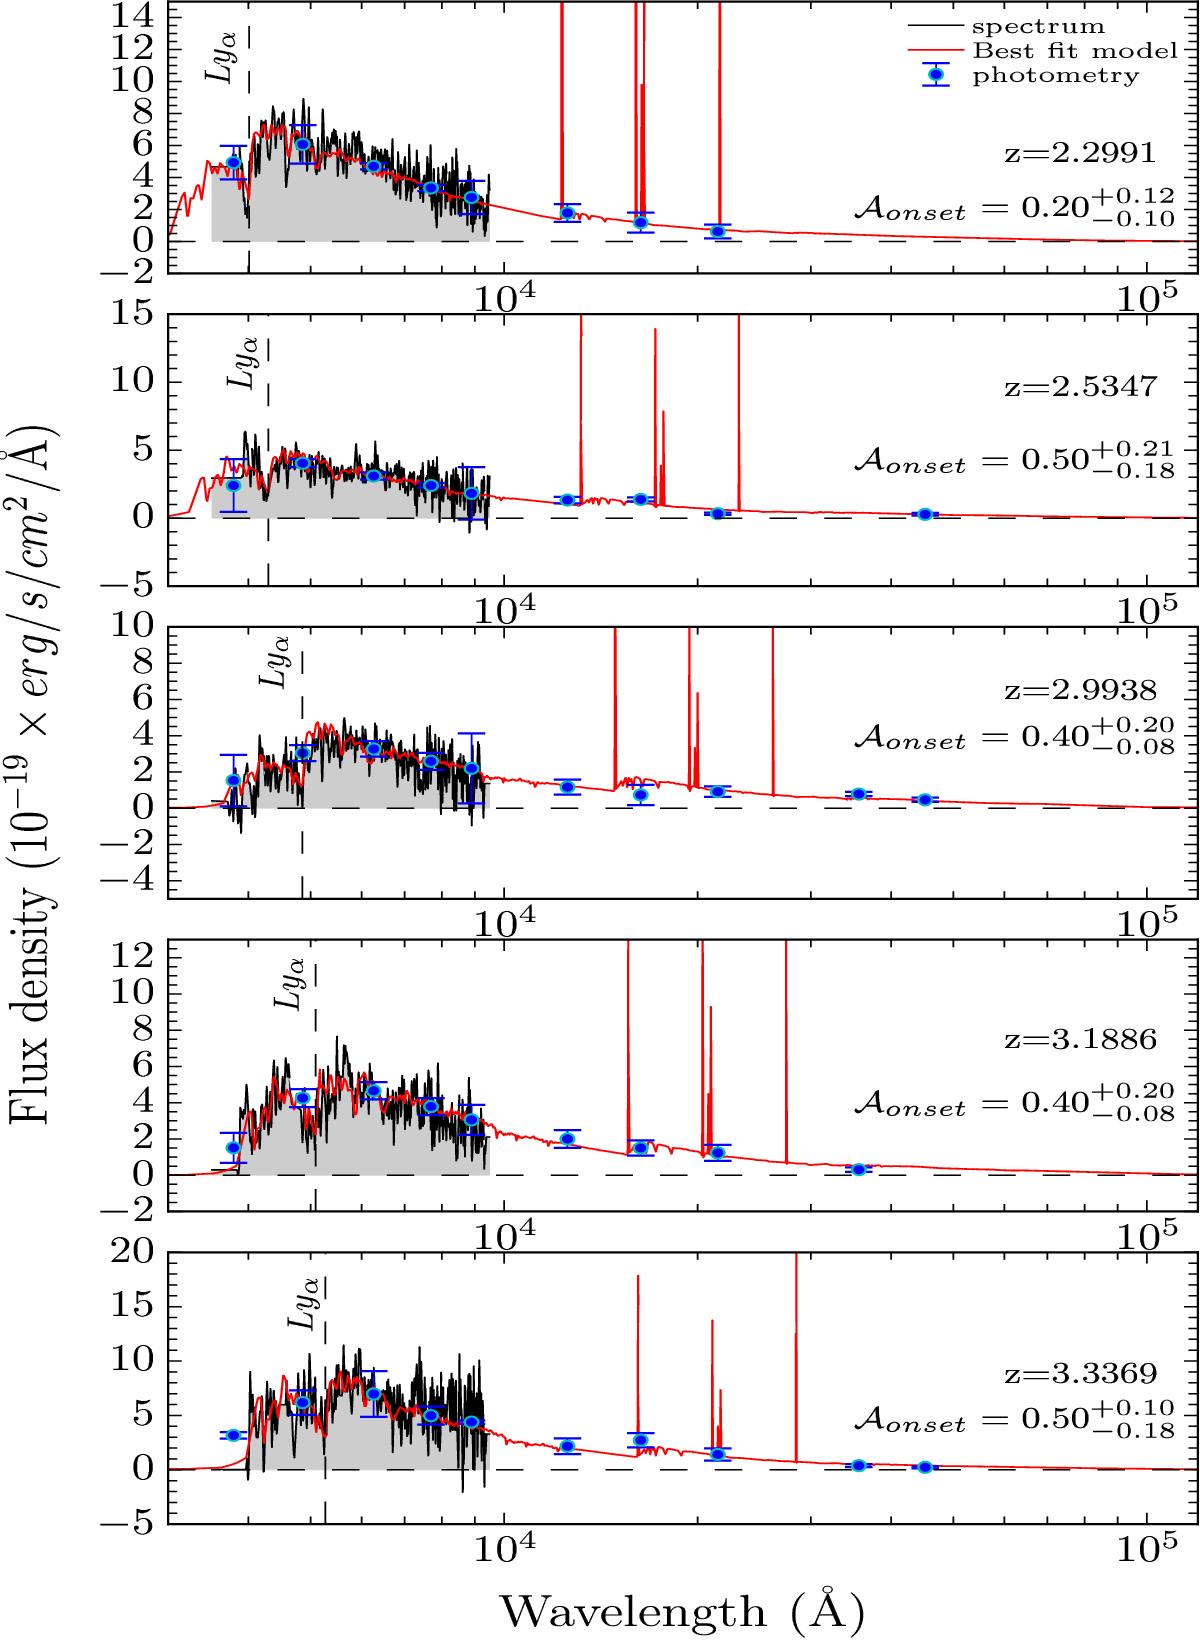
Five examples of fits in our galaxy sample between z = 2.2991 and z = 3.3369. In each panel the black line represents the VUDS spectroscopy, the blue points are the photometric points, and the best-fit template is in red. For each case, the template fit represents both photometric and spectroscopic data well.
Current usage metrics show cumulative count of Article Views (full-text article views including HTML views, PDF and ePub downloads, according to the available data) and Abstracts Views on Vision4Press platform.
Data correspond to usage on the plateform after 2015. The current usage metrics is available 48-96 hours after online publication and is updated daily on week days.
Initial download of the metrics may take a while.