Fig. 1
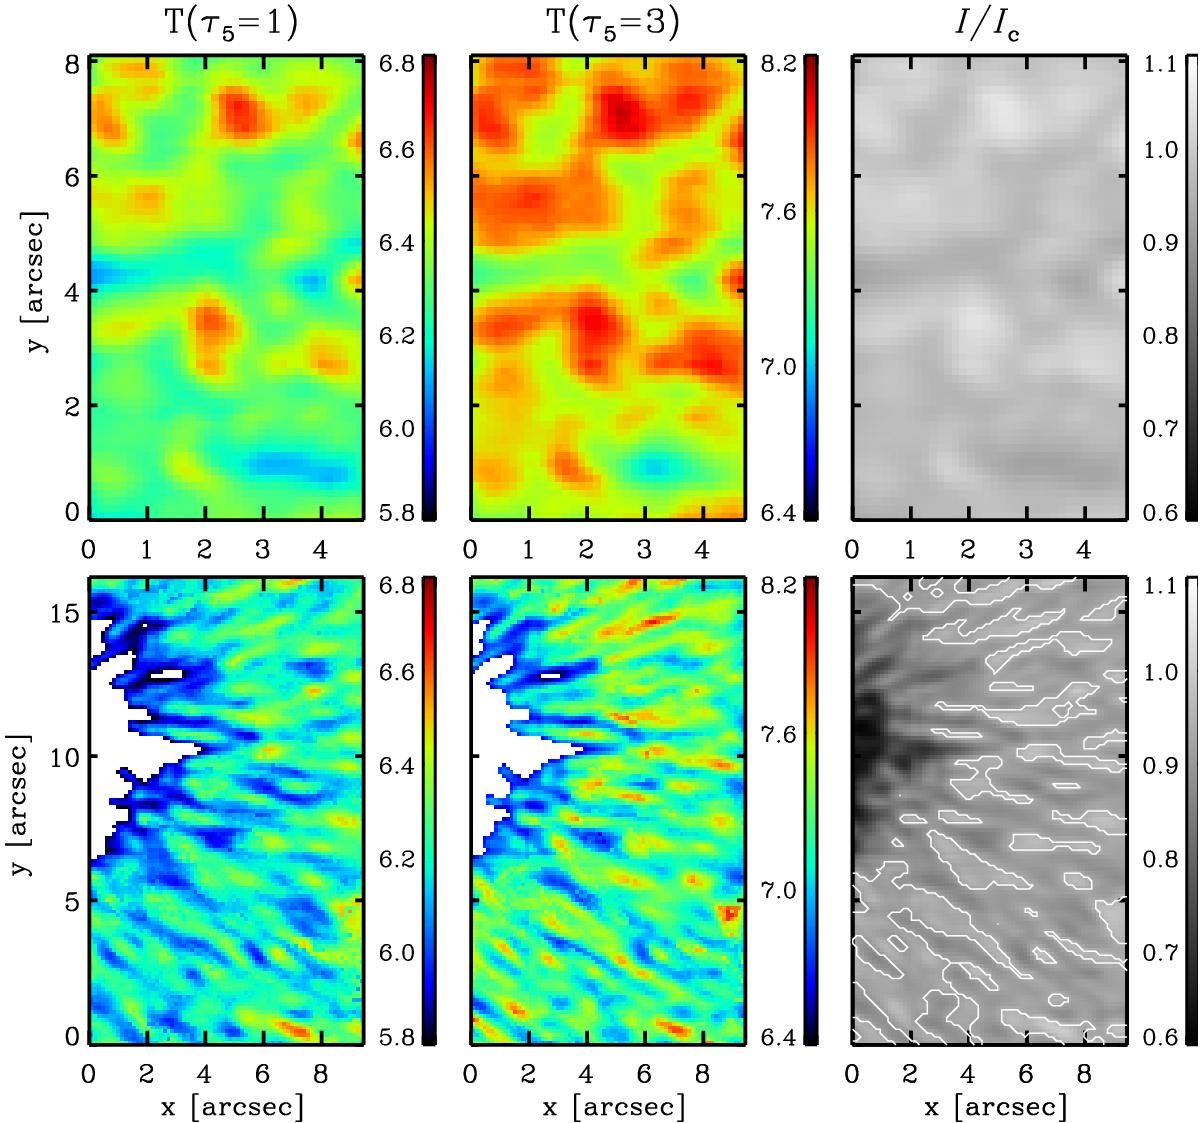
Temperatures in two different regions: quiet Sun (top) and penumbra (bottom). Results at optical depths τ5 = 1 and τ5 = 3 are displayed in the left and middle panels, respectively. Right panels show the normalized continuum intensity images. White contours in the bottom right panel (continuum intensity in the penumbra) enclose bright penumbral filaments, whereas white regions in the penumbral temperature maps (left and middle bottom panels) indicate the umbra. All values of the temperature are given in thousands of Kelvin.
Current usage metrics show cumulative count of Article Views (full-text article views including HTML views, PDF and ePub downloads, according to the available data) and Abstracts Views on Vision4Press platform.
Data correspond to usage on the plateform after 2015. The current usage metrics is available 48-96 hours after online publication and is updated daily on week days.
Initial download of the metrics may take a while.