Fig. 3
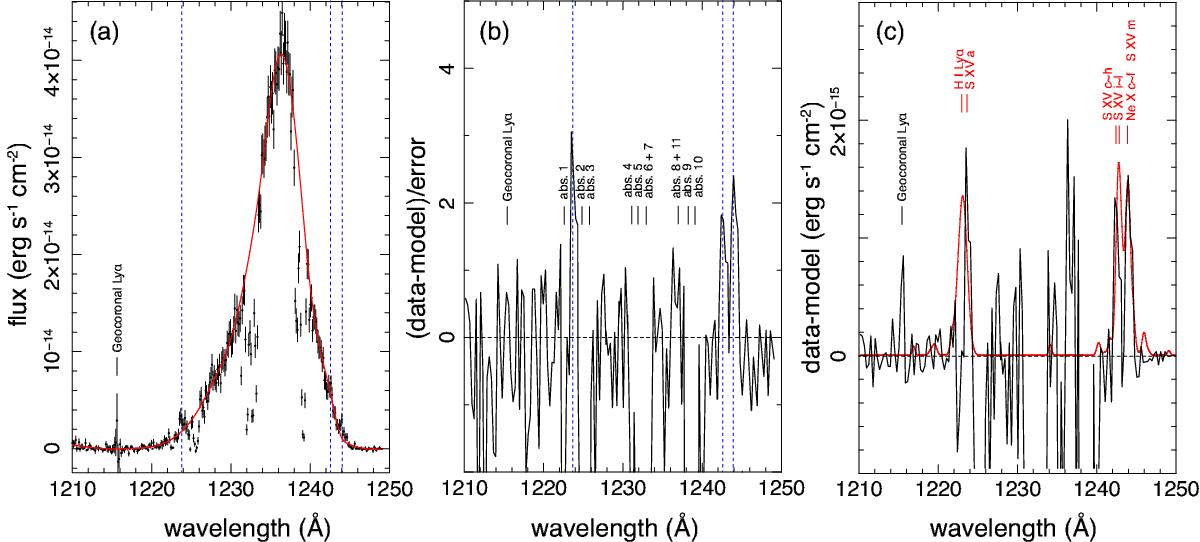
a) Observed Hubble/STIS spectrum of NGC 1275 uncorrected for reddening. The red curve shows the spline fitting to the broadened Lyα line profile. The known features, including the geocoronal line and absorption systems reported in Baum et al. (2005) are marked in the text. The three unidentified line features are also marked with blue vertical lines. b) Significance of the emission and absorption features with respect to the spline model. c) Residual spectrum, plotted together with the CX lines in arbitrary units. The transitions of the CX lines can be found in Table 1.
Current usage metrics show cumulative count of Article Views (full-text article views including HTML views, PDF and ePub downloads, according to the available data) and Abstracts Views on Vision4Press platform.
Data correspond to usage on the plateform after 2015. The current usage metrics is available 48-96 hours after online publication and is updated daily on week days.
Initial download of the metrics may take a while.