Fig. 2
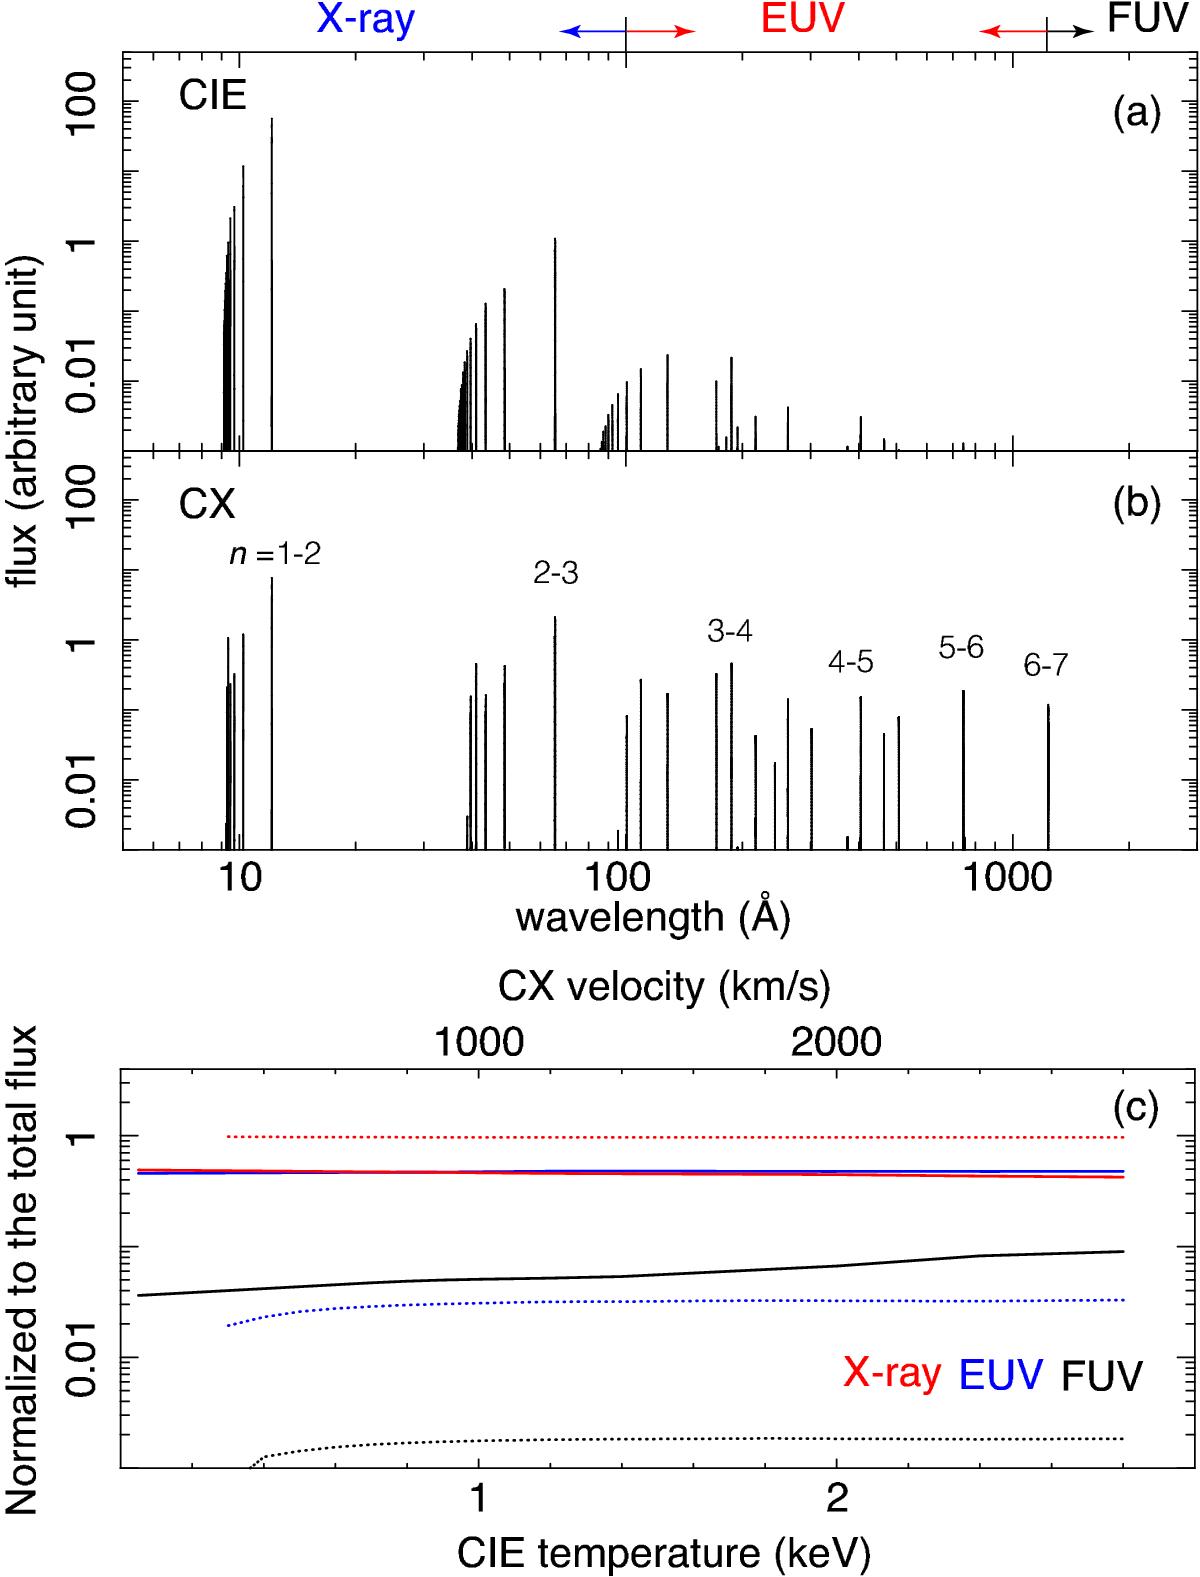
a) CIE and b) CX line spectra of Ne x. The CIE and CX temperature is set to 1 keV, and the CX velocity is set to 100 km s-1. The CX model is based on the AOCC calculation. c) FUV (black), EUV (blue), and X-ray (red) parts of the Ne x emission lines normalized to the total flux, plotted as a function of temperature and velocity for CIE and CX conditions, respectively. The solid and dotted lines show the CX and the CIE models, respectively.
Current usage metrics show cumulative count of Article Views (full-text article views including HTML views, PDF and ePub downloads, according to the available data) and Abstracts Views on Vision4Press platform.
Data correspond to usage on the plateform after 2015. The current usage metrics is available 48-96 hours after online publication and is updated daily on week days.
Initial download of the metrics may take a while.