Free Access
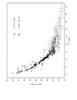
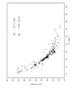
Fig. A.1
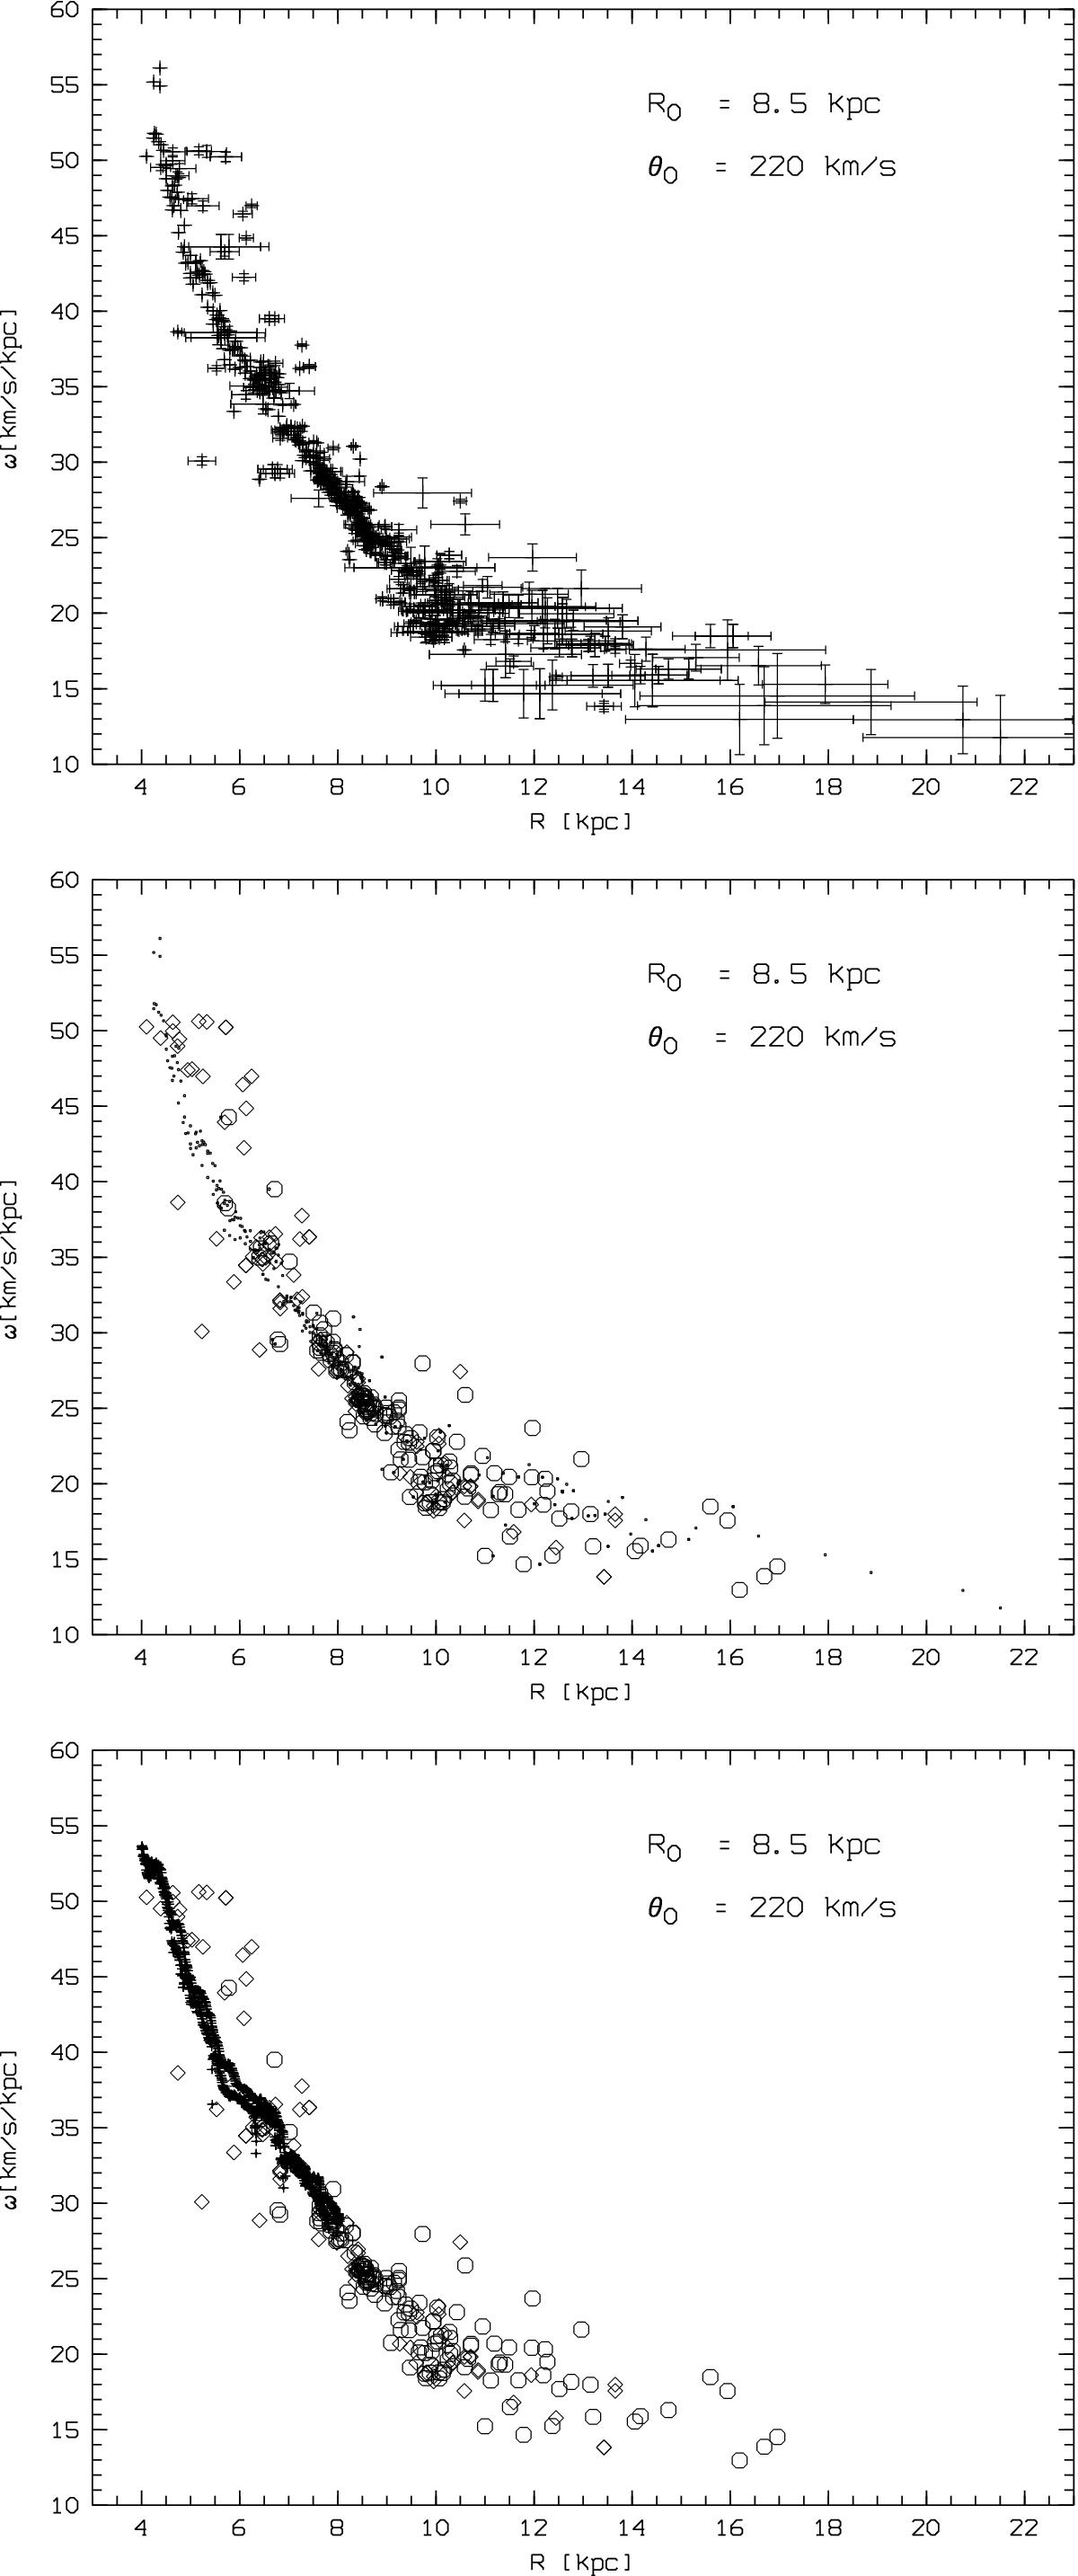
Data sample used for the rotation curve fitting. The upper panel shows the error bars. The middle panel shows sources from sample 1 (circles), sample 2 (diamonds), and sample 3 (dots), respectively. The lower panel shows sample 4 (dots) instead of sample 3 while the other symbols are similar as in middle panel.
This figure is made of several images, please see below:
Current usage metrics show cumulative count of Article Views (full-text article views including HTML views, PDF and ePub downloads, according to the available data) and Abstracts Views on Vision4Press platform.
Data correspond to usage on the plateform after 2015. The current usage metrics is available 48-96 hours after online publication and is updated daily on week days.
Initial download of the metrics may take a while.