Fig. 6
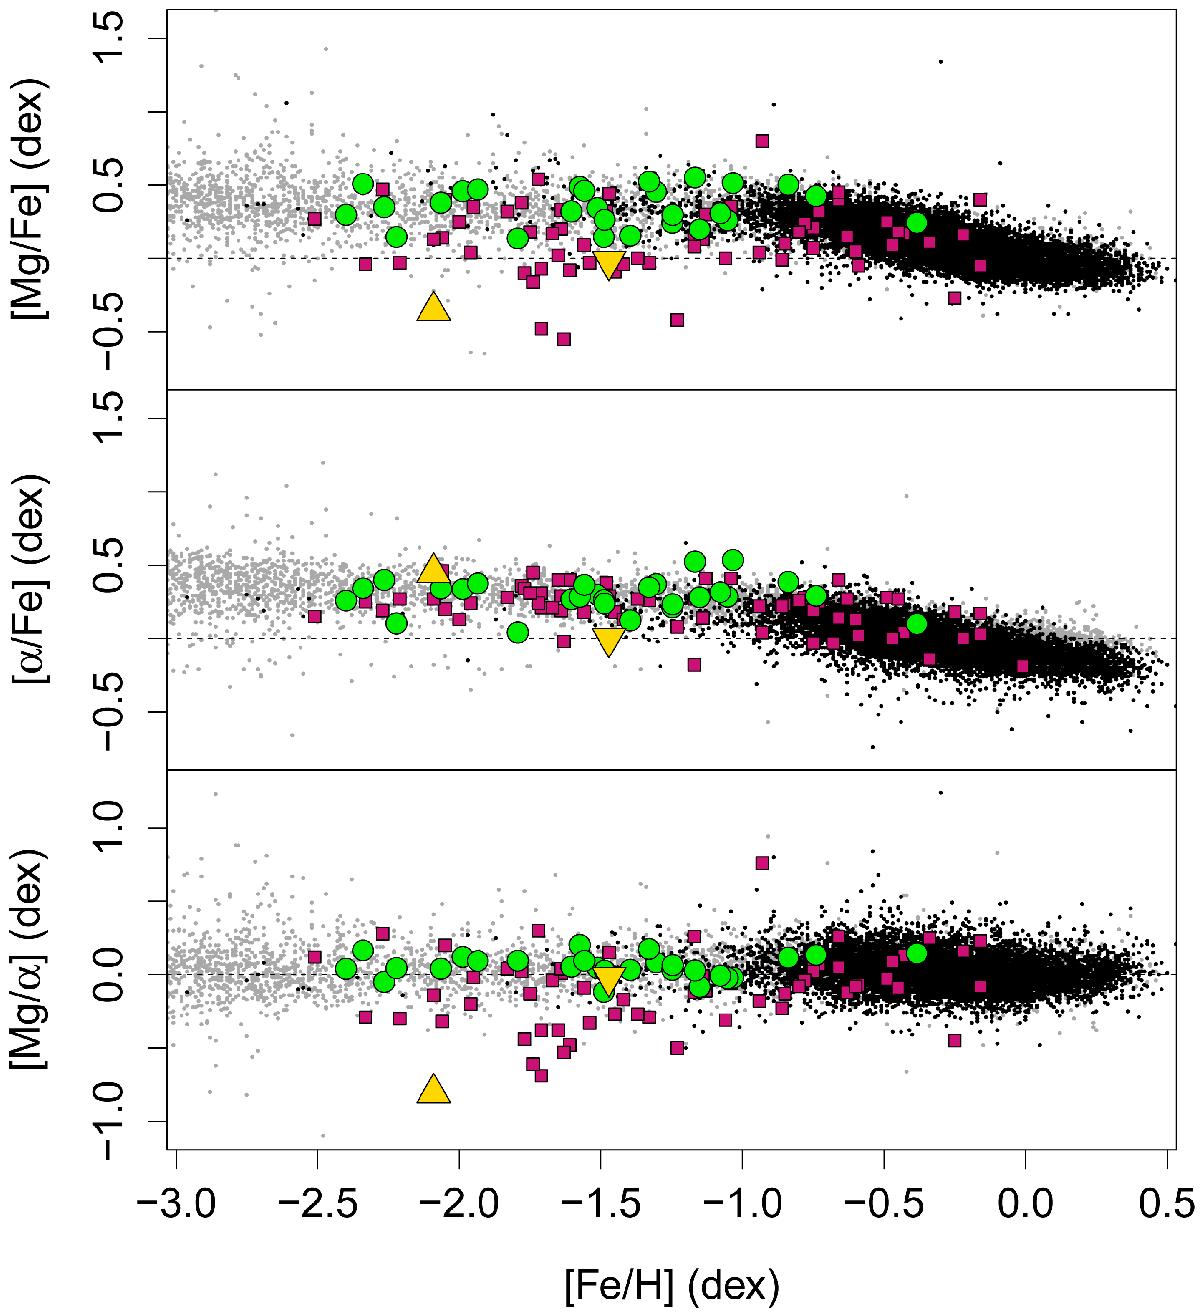
Average [Mg/Fe], [α/Fe], and [Mg/α] of our collected GES and literature sample of 28 MW GCs (green circles, see Sect. 4) and of the literature sample of extragalactic GCs (purple squares; see Sect. 4.3). The MW reference population is drawn from the GES iDR4 sample (black dots) and from the SAGA database of metal-poor stars (grey dots). We also plotted NGC 2419 as a yellow upward triangle and Ru 106 as a yellow downward triangle.
Current usage metrics show cumulative count of Article Views (full-text article views including HTML views, PDF and ePub downloads, according to the available data) and Abstracts Views on Vision4Press platform.
Data correspond to usage on the plateform after 2015. The current usage metrics is available 48-96 hours after online publication and is updated daily on week days.
Initial download of the metrics may take a while.