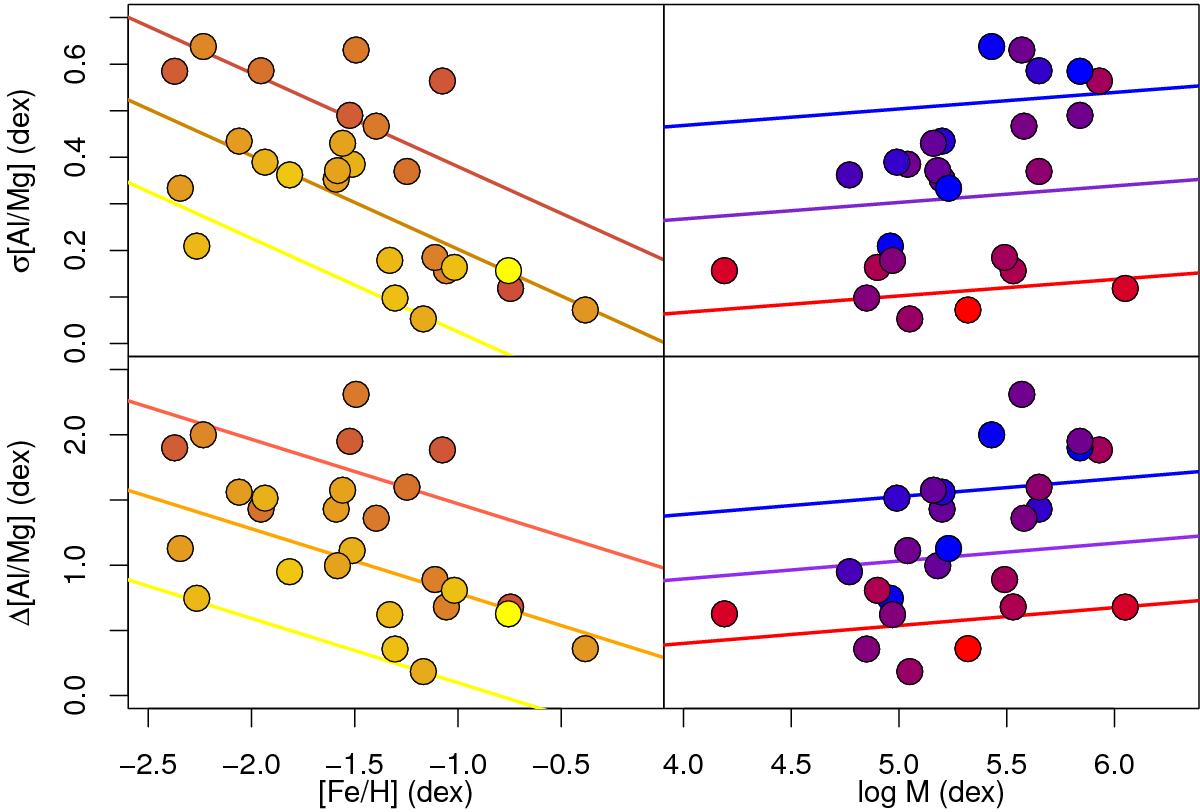
Fig. 5
Extent of the Mg-Al anti-correlation, measured as σ[Al/Mg] (top panels) and Δ[Al/Mg] (bottom panels), based on the sample described in the text. The behaviour as a function of average [Fe/H] (left panels) and total log M (present-day mass, right panels) of each GC is shown. The GCs in the left panels are coloured as a function of log M, where yellow corresponds to log M = 4.19 dex (the lowest mass in the sample) and dark orange to log M = 6.05 dex (the highest mass). In the right panels, points are coloured as a function of their metallicity with red corresponding to [ Fe / H ] = − 0.5 dex (the highest metallicity in the sample) and blue to [ Fe / H ] = − 2.5 dex (the lowest metallicity). Our models in the form a [ Fe / H ] + b log M + c are also plotted as lines coloured based on mass or metallicity.
Current usage metrics show cumulative count of Article Views (full-text article views including HTML views, PDF and ePub downloads, according to the available data) and Abstracts Views on Vision4Press platform.
Data correspond to usage on the plateform after 2015. The current usage metrics is available 48-96 hours after online publication and is updated daily on week days.
Initial download of the metrics may take a while.