Fig. 4
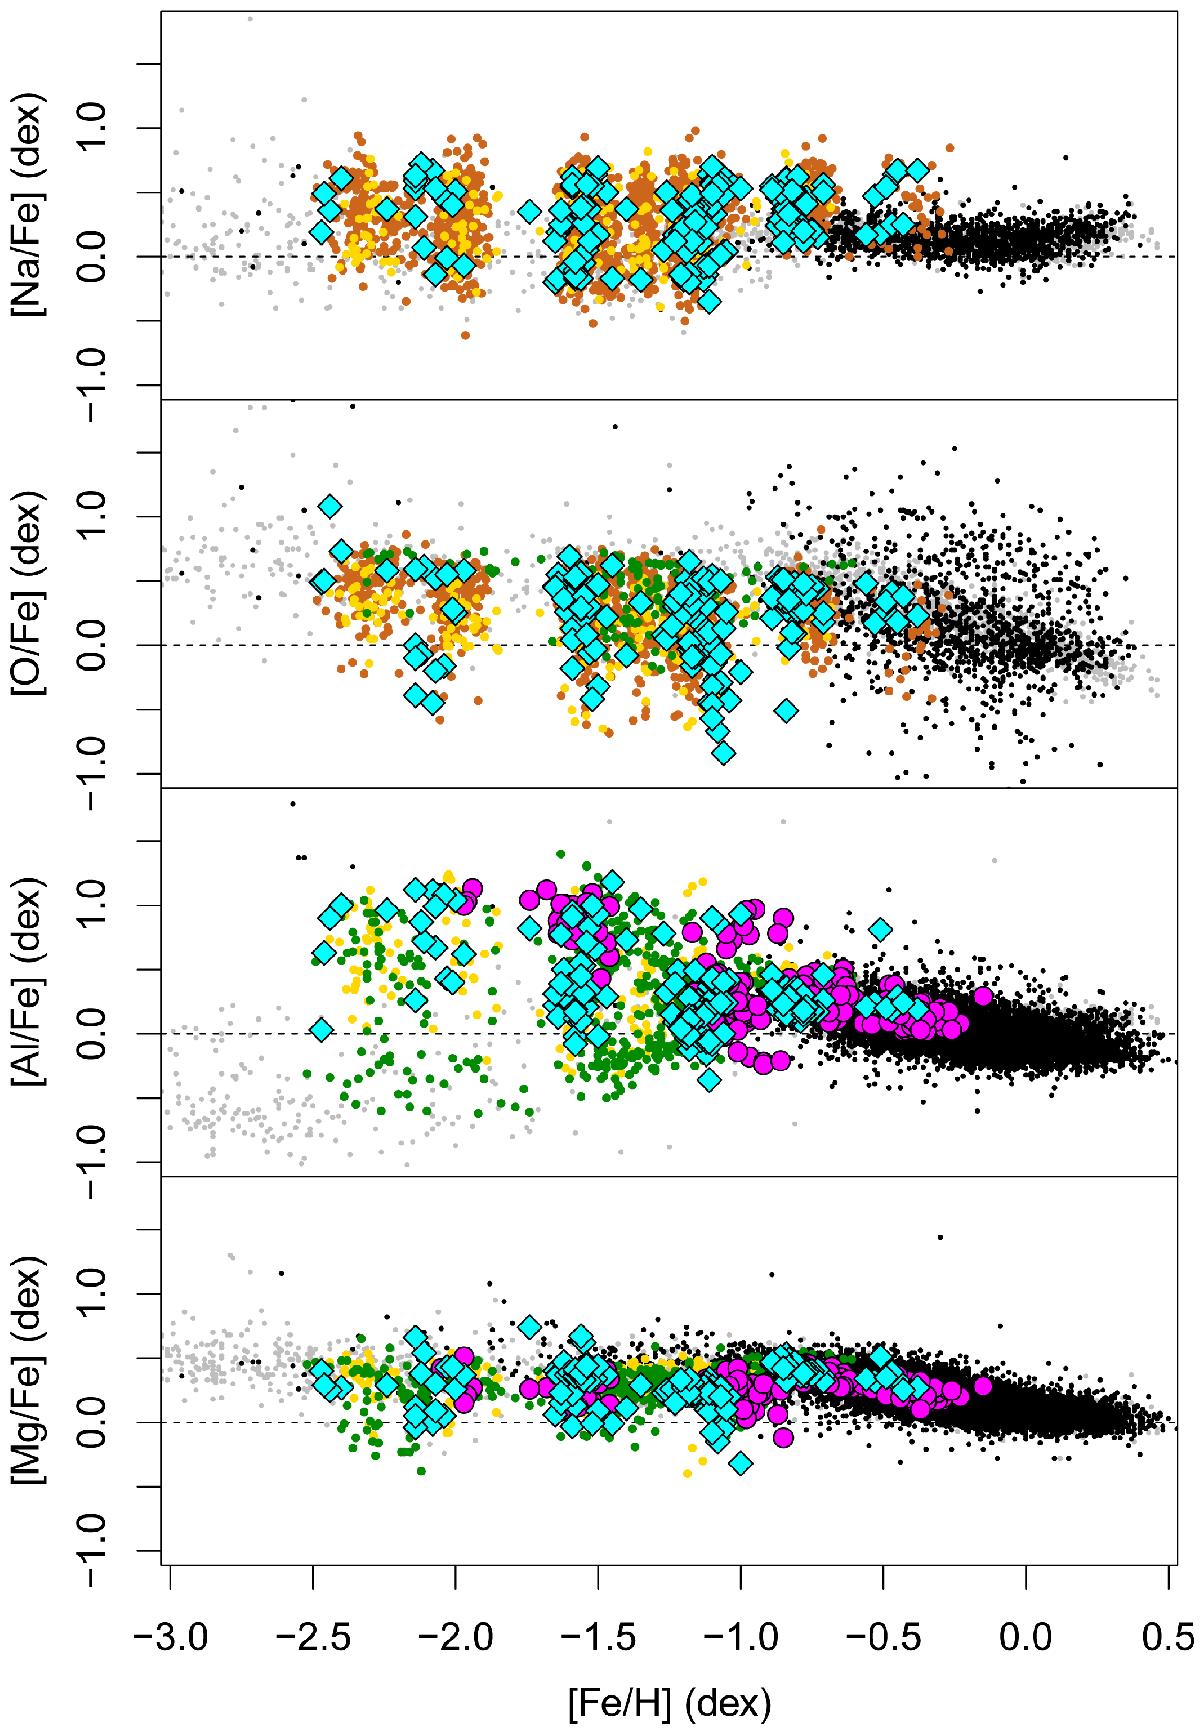
Run of the four main anti-correlated elements as a function of [Fe/H]. For MW field stars, GES iDR4 results are plotted as black dots and SAGA metal-poor stars as grey dots. Homogenized APOGEE data are plotted in green and FLAMES GC surveys data are plotted in yellow for UVES and brown for GIRAFFE. GES iDR4 measurements are plotted in cyan for UVES and magenta for GIRAFFE.
Current usage metrics show cumulative count of Article Views (full-text article views including HTML views, PDF and ePub downloads, according to the available data) and Abstracts Views on Vision4Press platform.
Data correspond to usage on the plateform after 2015. The current usage metrics is available 48-96 hours after online publication and is updated daily on week days.
Initial download of the metrics may take a while.