Fig. 3
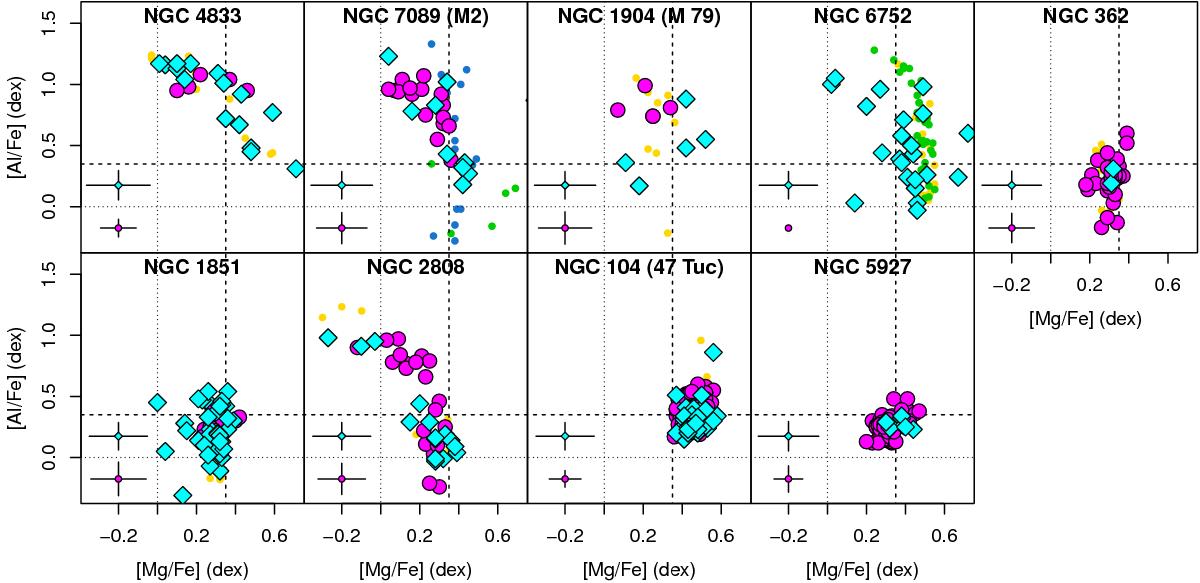
Mg-Al anti-correlation. Panels show different GCs, sorted by increasing metallicity from left to right and from top to bottom. Dotted lines indicate the solar abundance ratios, dashed lines the typical halo α-enhanced ratios. The GES UVES data are plotted as cyan diamonds; GIRAFFE data as magenta circles; UVES literature data from the FLAMES GC survey are plotted in gold; NGC 6752 and M 2 data by Yong et al. (2005 and 2014) are plotted in green; M 2 data by Mészáros et al. (2015) are plotted in blue. Typical (median) error bars are reported on the bottom left corner of each panel.
Current usage metrics show cumulative count of Article Views (full-text article views including HTML views, PDF and ePub downloads, according to the available data) and Abstracts Views on Vision4Press platform.
Data correspond to usage on the plateform after 2015. The current usage metrics is available 48-96 hours after online publication and is updated daily on week days.
Initial download of the metrics may take a while.