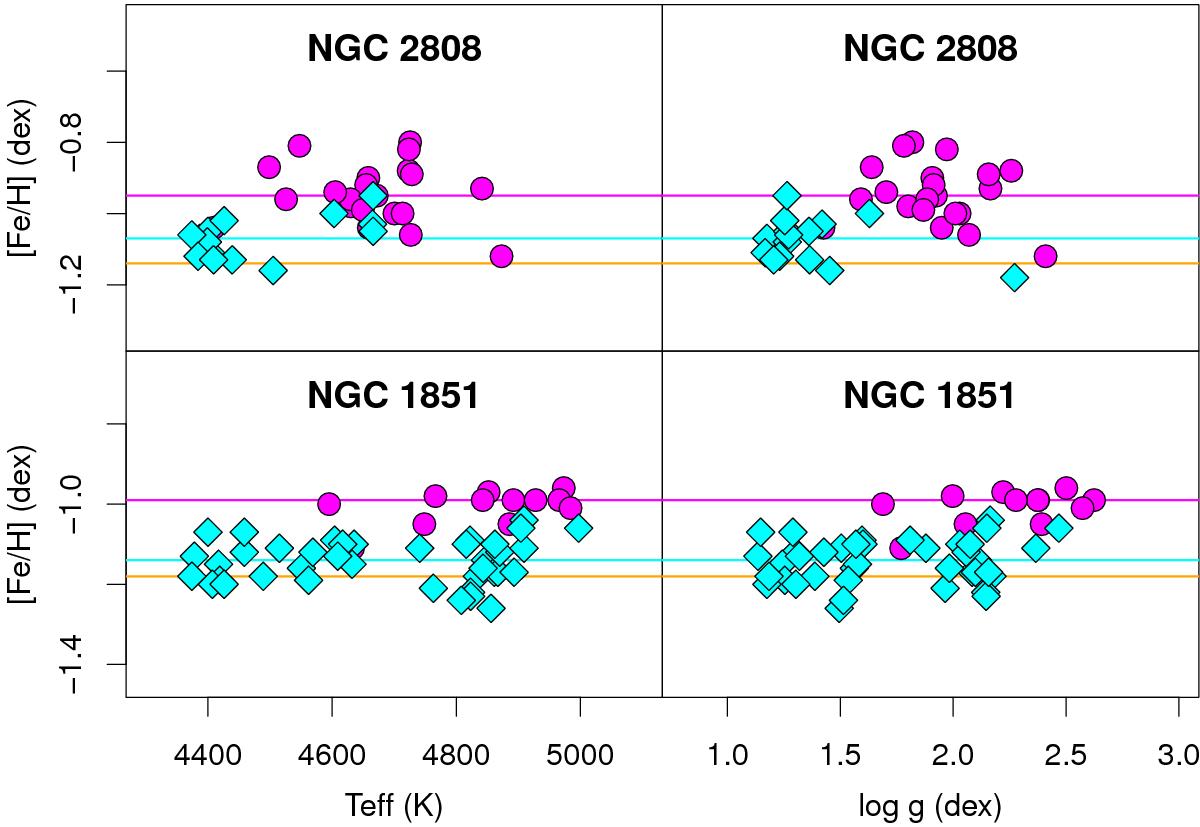
Fig. 1

Example of the small (compared to the errors and internal spreads) residual offsets in [Fe/H] between UVES and GIRAFFE in GES iDR4 data, in two of the sample GCs: NGC 2808 (top panels) and NGC 1851 (bottom panels). The left panels show [Fe/H] as a function of Teff and the right panels show [Fe/H] as a function of log g. The UVES stars are plotted as cyan symbols with their median [Fe/H] as a cyan line. The GIRAFFE stars are plotted as magenta symbols with their median [Fe/H] as a magenta line. The reference [Fe/H] from Harris (1996, 2010) is plotted as an orange line.
Current usage metrics show cumulative count of Article Views (full-text article views including HTML views, PDF and ePub downloads, according to the available data) and Abstracts Views on Vision4Press platform.
Data correspond to usage on the plateform after 2015. The current usage metrics is available 48-96 hours after online publication and is updated daily on week days.
Initial download of the metrics may take a while.


