Fig. 5
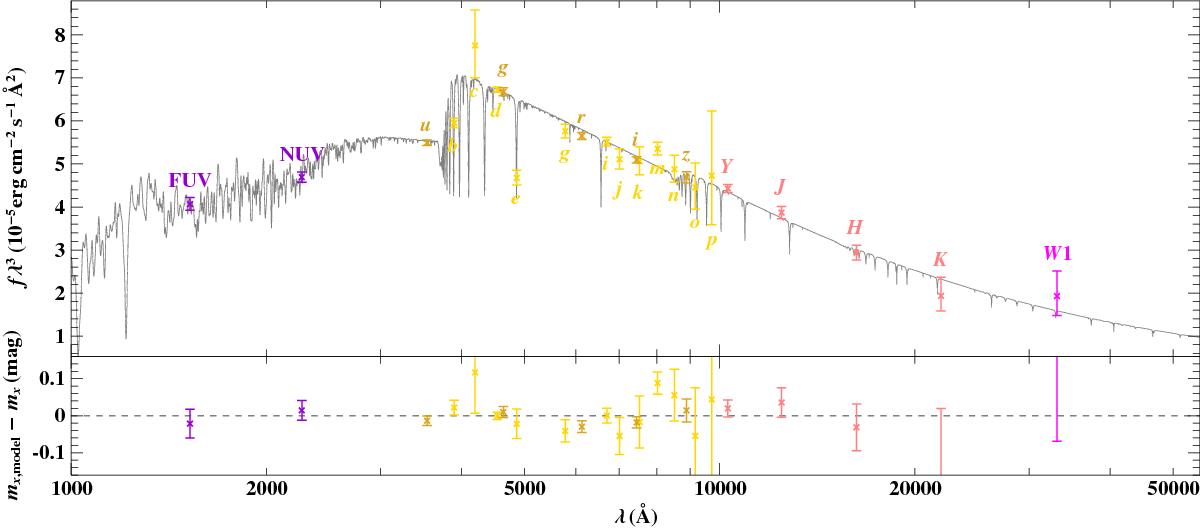
Comparison of synthetic and observed photometry of J1231: the top panel shows the spectral energy distribution. The colored data points are fluxes that are converted from observed magnitudes, and the solid grey line is the model. The residual panel at the bottom shows the differences between synthetic and observed magnitudes. The photometric systems have the following color code: GALEX (violet), BATC (gold), SDSS (goldenred), UKIDSS (pink), and WISE (magenta).
Current usage metrics show cumulative count of Article Views (full-text article views including HTML views, PDF and ePub downloads, according to the available data) and Abstracts Views on Vision4Press platform.
Data correspond to usage on the plateform after 2015. The current usage metrics is available 48-96 hours after online publication and is updated daily on week days.
Initial download of the metrics may take a while.