Fig. 4
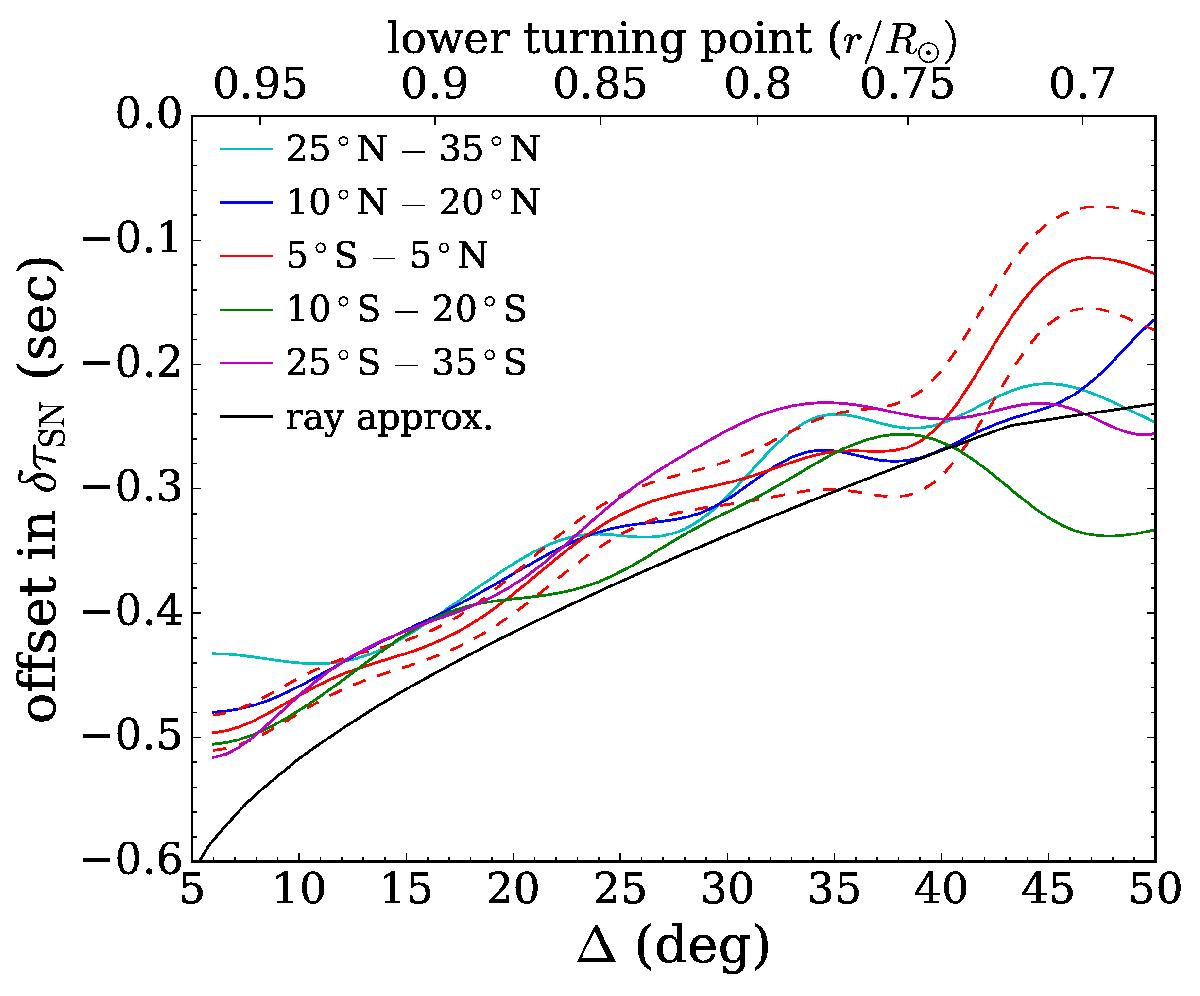
Offsets between P-angle corrected and uncorrected δτSN measured from MDI data as a function of travel distance Δ. A negative value corresponds to a southward flow owing to the P-angle error. The offsets in δτSN are averaged over 10° bands around selected latitudes as labeled in the legend. Gaussian smoothing, with FWHM = 7.2° in Δ, is applied here. The errors of only one curve, computed from the standard errors of the mean within each 7.2° segment, are shown with dashed lines and those of other curves are similar. The black solid line is a ray approximation of travel-time differences arising from a simple model of the leaking flow described in the text. The corresponding radii of lower turning points from the ray approximation are indicated at the top.
Current usage metrics show cumulative count of Article Views (full-text article views including HTML views, PDF and ePub downloads, according to the available data) and Abstracts Views on Vision4Press platform.
Data correspond to usage on the plateform after 2015. The current usage metrics is available 48-96 hours after online publication and is updated daily on week days.
Initial download of the metrics may take a while.