Fig. 3
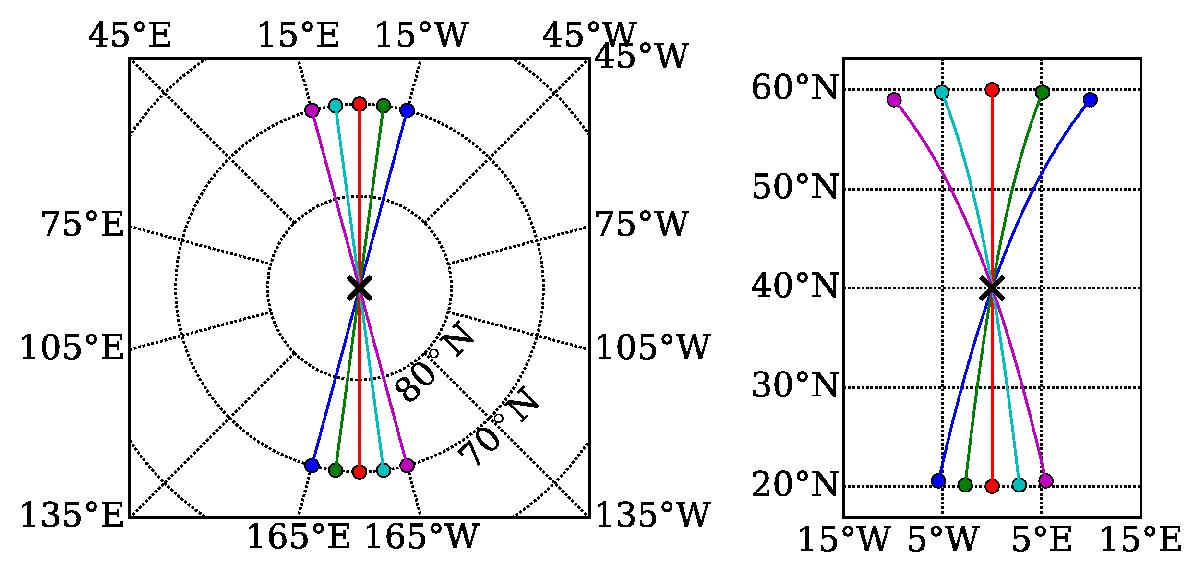
Left: schematic plot of an arc-to-arc geometry in the polar projection with a travel distance of 40° and an arc size of 30° as an example. The end points (solid points) on the two arcs all have the same distance of 20° from the central point (cross symbol). The solid lines connecting pairs of points show the great circles. Right: same configuration as in the left panel but rotating the coordinates to a different latitude and transforming into cylindrical projection. Whereas the distances and azimuths between points are preserved during the coordinate transformation, the arcs in the right panel are stretched due to the distortion introduced by the projection. The cross-correlation functions between pairs of end points connected by the great circles are computed, averaged over different pairs of points, and then assigned to the central point. The number of points on the arc shown here is less than in real cases for clarity.
Current usage metrics show cumulative count of Article Views (full-text article views including HTML views, PDF and ePub downloads, according to the available data) and Abstracts Views on Vision4Press platform.
Data correspond to usage on the plateform after 2015. The current usage metrics is available 48-96 hours after online publication and is updated daily on week days.
Initial download of the metrics may take a while.