Fig. A.1
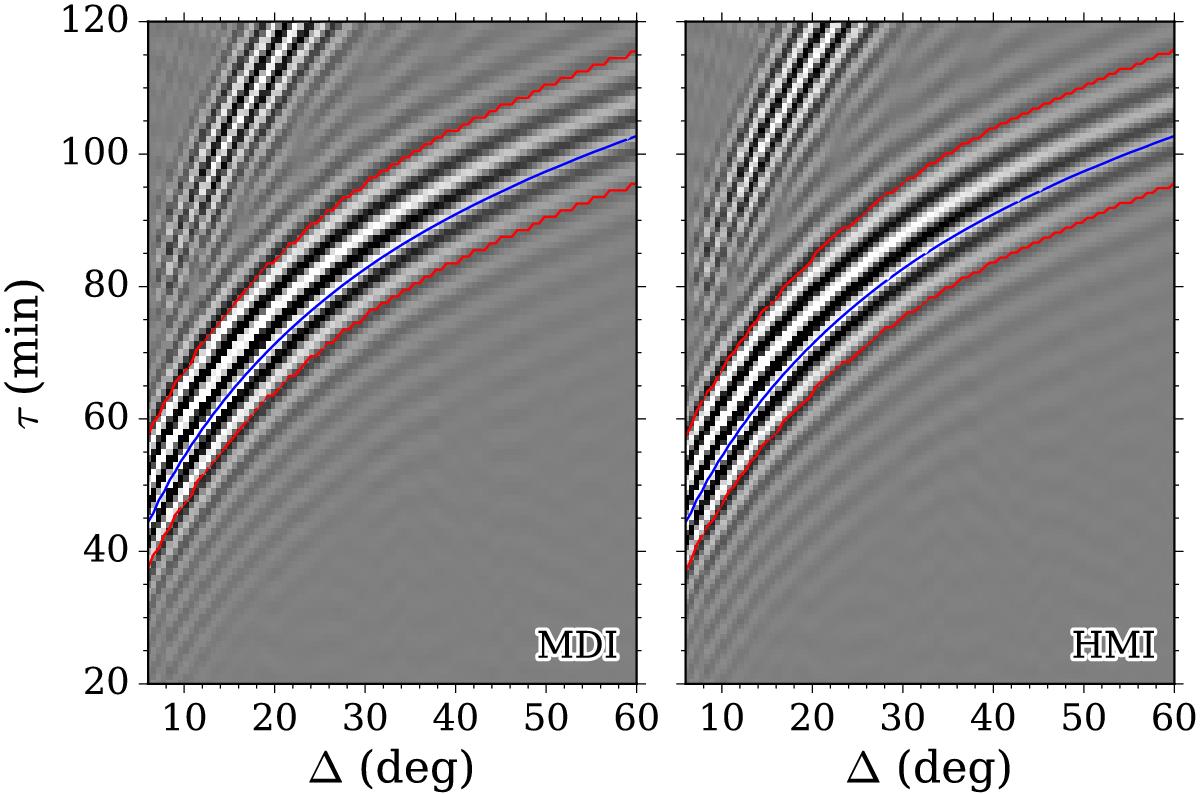
Examples of 288-day averaged cross-correlation function obtained from MDI (left) and HMI (right) as a function of distance, Δ, and time lag, τ. They are computed in the south-north direction and averaged over ± 15° longitude and ± 15° latitude. A 20-min window that isolates the first-skip branch of the cross-correlation function is used in the fitting (20 data points for MDI and 27 data points for HMI). In both panels, the blue curve represents the fitted phase time and the red curves indicate the border of the fitting window for each Δ. The center positions of the fitting window and the fitted phase times for every 3° of travel distance are listed in Table A.1.
Current usage metrics show cumulative count of Article Views (full-text article views including HTML views, PDF and ePub downloads, according to the available data) and Abstracts Views on Vision4Press platform.
Data correspond to usage on the plateform after 2015. The current usage metrics is available 48-96 hours after online publication and is updated daily on week days.
Initial download of the metrics may take a while.