Fig. 11
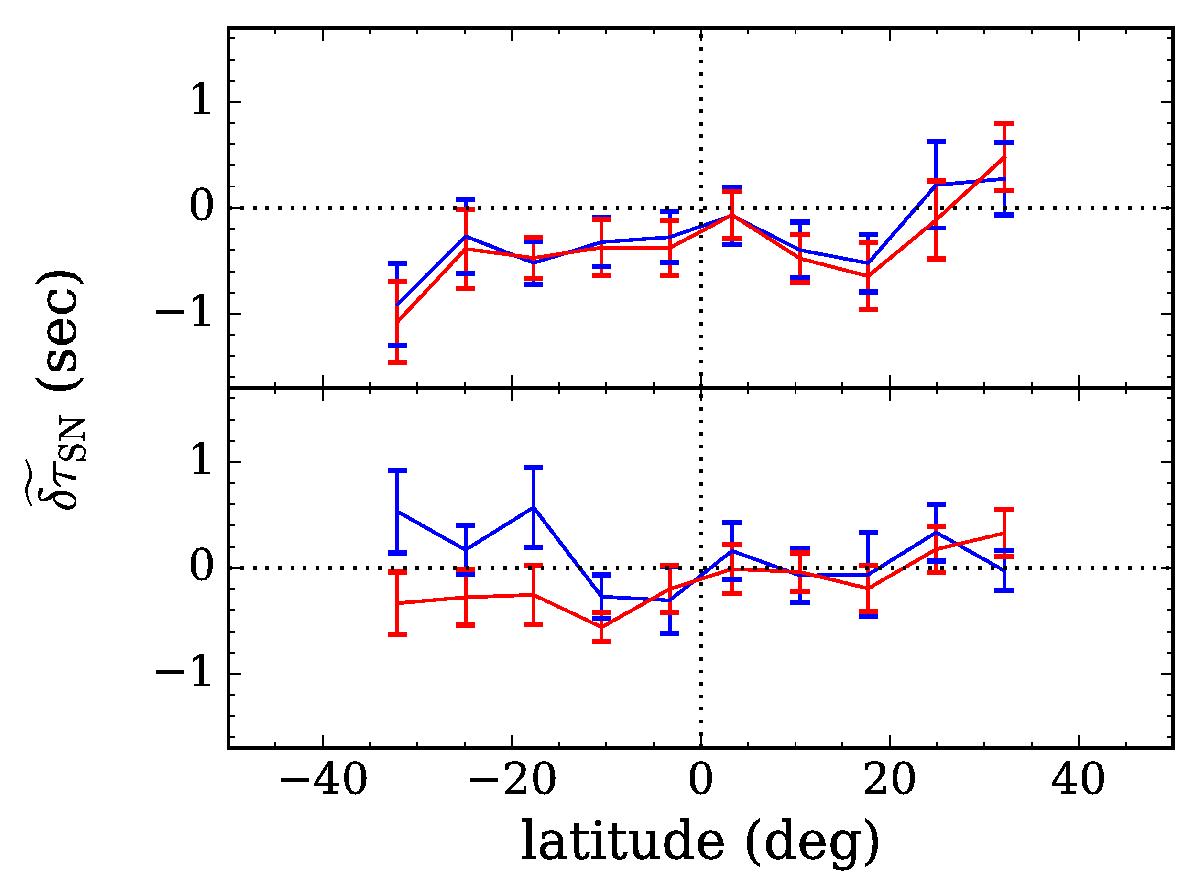
Comparison of ![]() between MDI (blue) and HMI (red) using data in the periods when SOHO spacecraft was “upright” (upper) and “upside down” (lower). The data are averaged over the travel-distance range 20.4°–34.2° as in the third panel of Fig. 8. Unlike in the non-flipping periods, the discrepancies between the two curves become noticeable in the flipping periods.
between MDI (blue) and HMI (red) using data in the periods when SOHO spacecraft was “upright” (upper) and “upside down” (lower). The data are averaged over the travel-distance range 20.4°–34.2° as in the third panel of Fig. 8. Unlike in the non-flipping periods, the discrepancies between the two curves become noticeable in the flipping periods.
Current usage metrics show cumulative count of Article Views (full-text article views including HTML views, PDF and ePub downloads, according to the available data) and Abstracts Views on Vision4Press platform.
Data correspond to usage on the plateform after 2015. The current usage metrics is available 48-96 hours after online publication and is updated daily on week days.
Initial download of the metrics may take a while.