Fig. 10
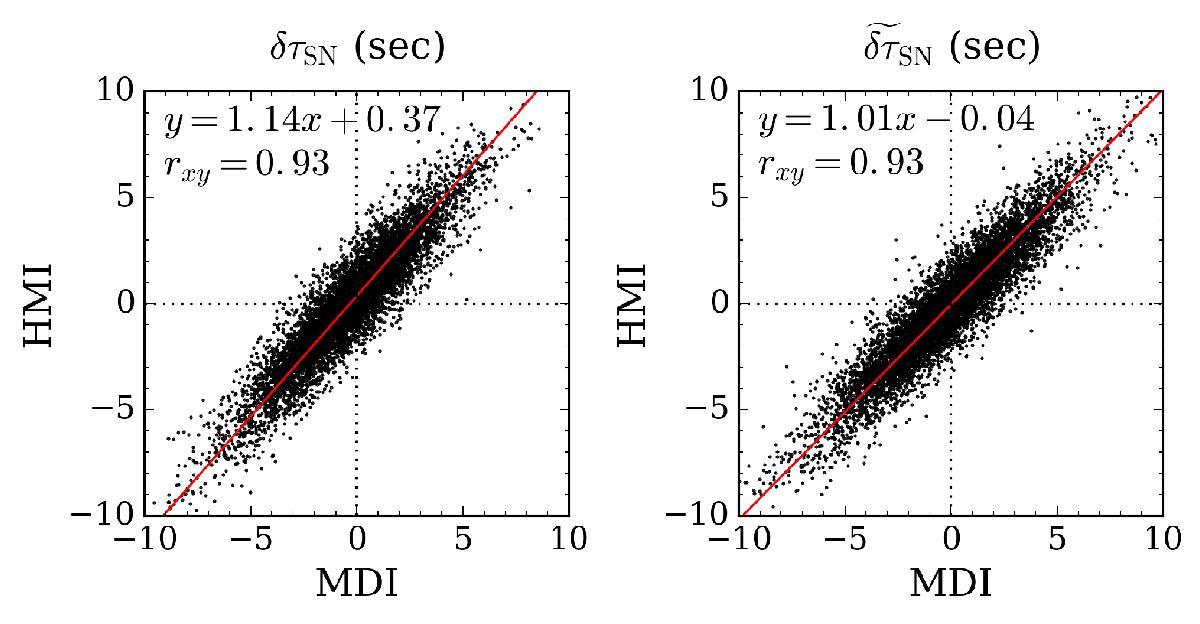
Left: scatter plot of δτSN from HMI (y-axis) vs. MDI (x-axis) for all available latitudes and travel distances ranging from 10.2° to 45°. The center-to-limb variation and MDI P-angle error are not corrected. Right: same as in the left panel but with corrections to the center-to-limb variation and the MDI P-angle. The red lines refer to linear functions that fit the data points assuming equal errors in both coordinates (Press et al. 1992, Sect. 15.3). The Pearson correlation coefficients, rxy, between the two data sets and the fitted linear functions are labeled in each panel.
Current usage metrics show cumulative count of Article Views (full-text article views including HTML views, PDF and ePub downloads, according to the available data) and Abstracts Views on Vision4Press platform.
Data correspond to usage on the plateform after 2015. The current usage metrics is available 48-96 hours after online publication and is updated daily on week days.
Initial download of the metrics may take a while.