Fig. 1
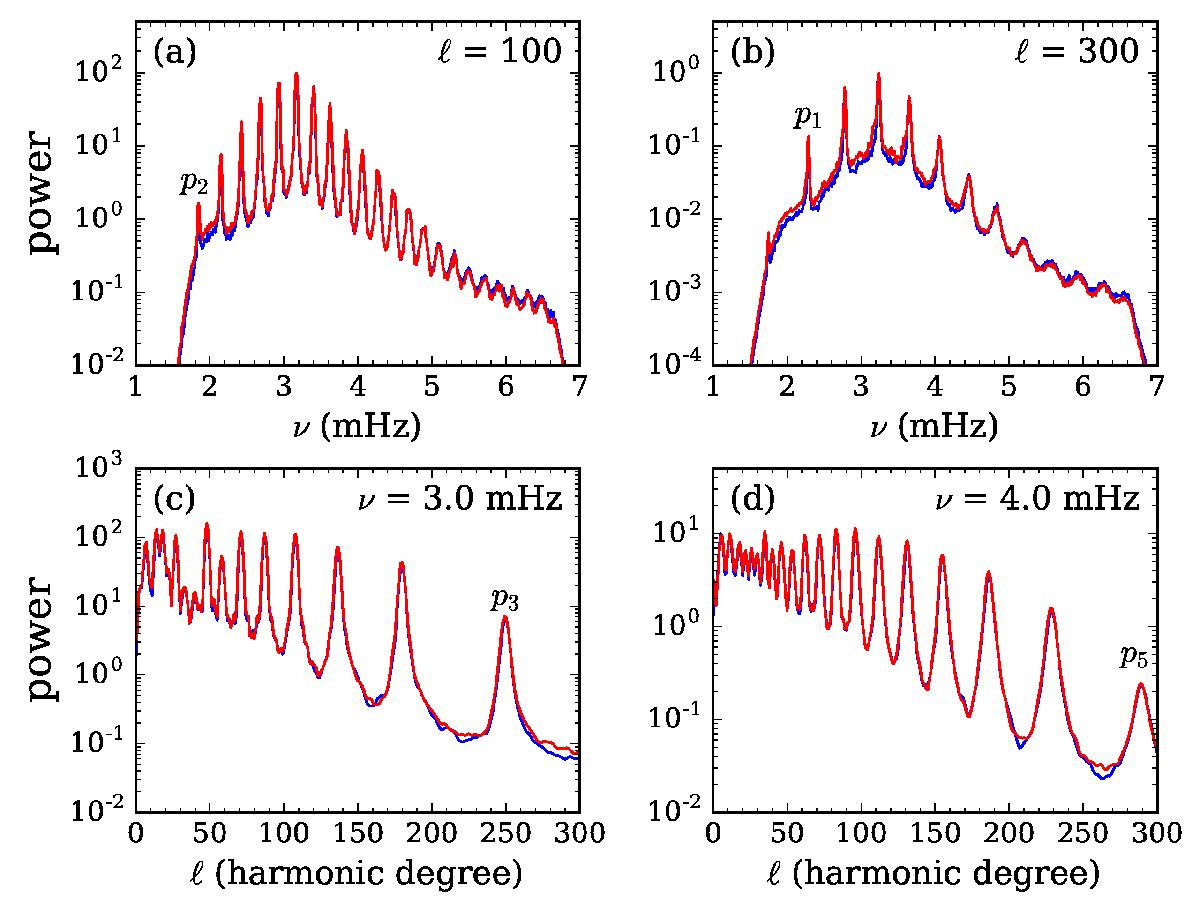
Comparisons of m-averaged power spectra between MDI (blue) and HMI (red) obtained from one-day tracked Dopplergrams. The upper panels show the power as a function of frequency at selected harmonic degrees: a) ℓ = 100 and b) ℓ = 300. The lower panels show the power as a function of harmonic degree at selected frequencies: c) 3.0 mHz and d) 4.0 mHz. Selected modes have been labeled. The power is normalized by the square of the number of frames.
Current usage metrics show cumulative count of Article Views (full-text article views including HTML views, PDF and ePub downloads, according to the available data) and Abstracts Views on Vision4Press platform.
Data correspond to usage on the plateform after 2015. The current usage metrics is available 48-96 hours after online publication and is updated daily on week days.
Initial download of the metrics may take a while.