Fig. 8
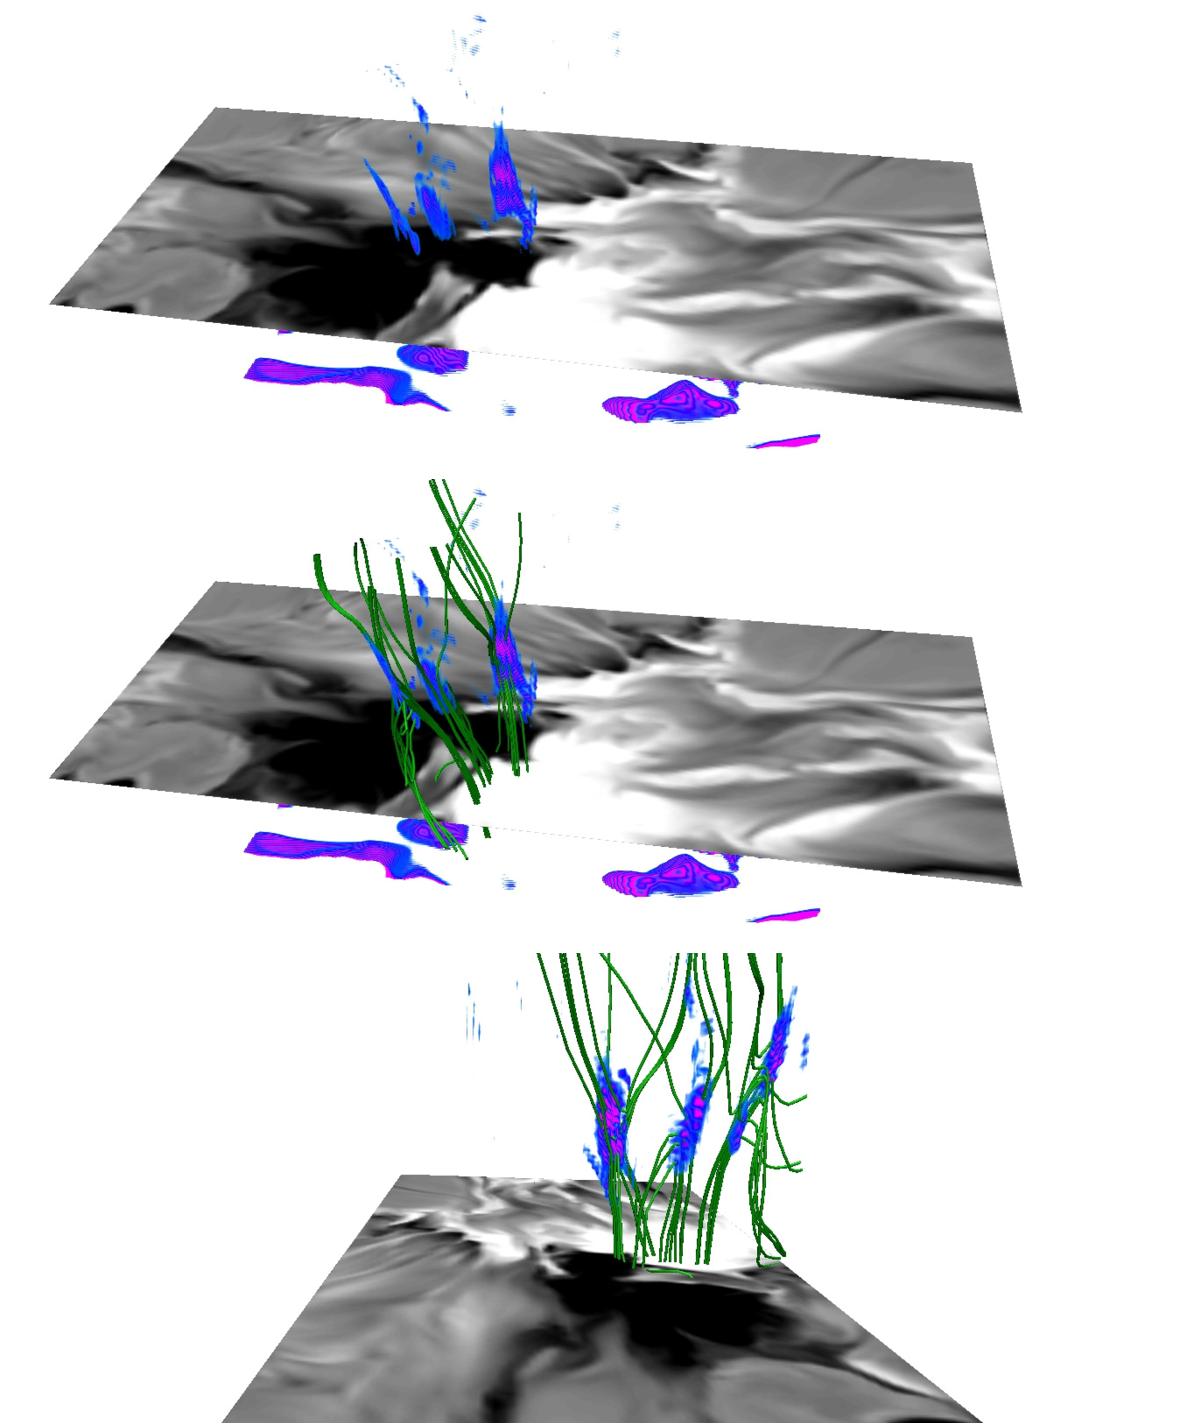
Zoom in on a small part of the simulation domain at t = 549 s at [11′′, 1′′]. The horizontal panels show the vertical component of the magnetic field at the surface. The blue/purple rendering depicts the temperature in the range of 7500−9000 K and the green lines show the magnetic field configuration at these locations. The bottom panel shows the same region as the upper two, but from a different viewing angle.
Current usage metrics show cumulative count of Article Views (full-text article views including HTML views, PDF and ePub downloads, according to the available data) and Abstracts Views on Vision4Press platform.
Data correspond to usage on the plateform after 2015. The current usage metrics is available 48-96 hours after online publication and is updated daily on week days.
Initial download of the metrics may take a while.