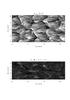
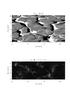
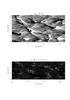
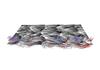
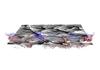
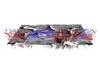
Fig. 7

Vertical component of magnetic field (top row), Hα wing intensity (middle row), and field topology (bottom row) at t = 112,197, and 549 s from left to right. The colour-coding of the field lines in the bottom panels corresponds to the vertical velocity with upflows being blue. Horizontal planes show the vertical component of the magnetic field at the surface. The magnetograms are cropped at ± 1 kG and normalized Hα-wing intensity at 0.7 to 4.5.


Current usage metrics show cumulative count of Article Views (full-text article views including HTML views, PDF and ePub downloads, according to the available data) and Abstracts Views on Vision4Press platform.
Data correspond to usage on the plateform after 2015. The current usage metrics is available 48-96 hours after online publication and is updated daily on week days.
Initial download of the metrics may take a while.