Fig. 2
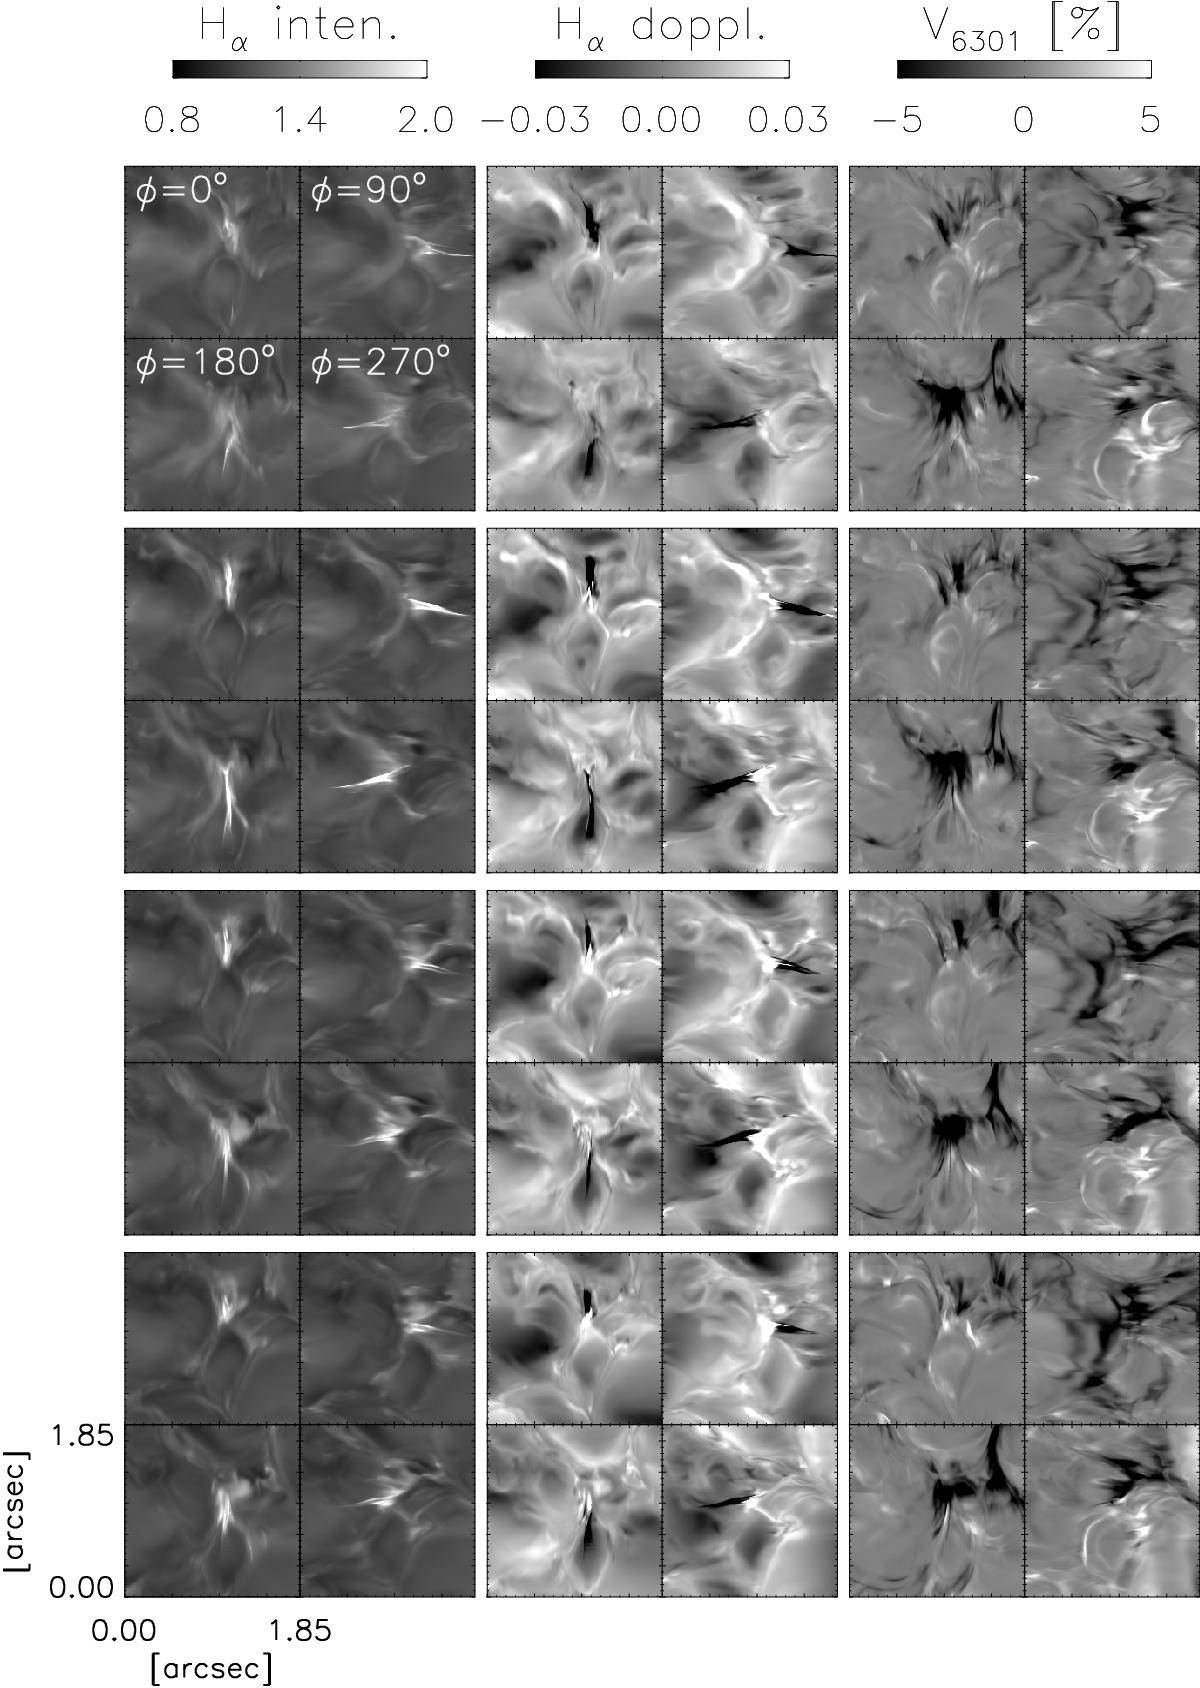
Details of the EB-like feature for the last four samples in Fig. 1, ordered top to bottom. For each sample time, the first column shows a quartet of synthetic intensity images in the Hα wing at Δλ = −0.11 nm from line centre at viewing angle θ = 49° (μ = 0.66), from four different azimuthal viewing directions φ as specified. The intensity is normalized to the mean continuum intensity over the whole field of view. The second column shows corresponding synthetic Hα Dopplergrams obtained by subtracting normalized blue-wing intensity from red-wing intensity at Δλ = ± 0.11 nm. The third column shows corresponding synthetic magnetograms obtained from the Fe I 6301 Å line at Δλ = −48 mÅ from line centre. The values indicate the amount of normalized circular polarization.
Current usage metrics show cumulative count of Article Views (full-text article views including HTML views, PDF and ePub downloads, according to the available data) and Abstracts Views on Vision4Press platform.
Data correspond to usage on the plateform after 2015. The current usage metrics is available 48-96 hours after online publication and is updated daily on week days.
Initial download of the metrics may take a while.