Fig. 1
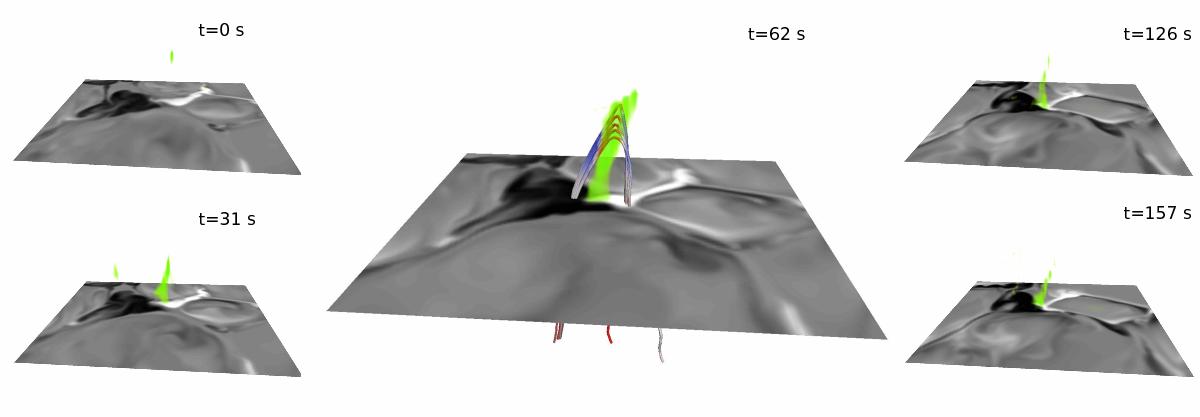
Results from the weak-field MURaM simulation at half-minute intervals, ordered along columns. The grey scale in the horizontal planes shows the vertical component of the magnetic field at the geometrical height where ⟨ τ ⟩ = 0.1. The third sample is enlarged for better visibility. Green denotes volume rendering of temperature in the range T = 5700−6500 K and outlines the site with most ohmic heating. Some magnetic field lines are shown in the middle panel, colour-coded according to vertical gas velocity (downflows red, upflows blue). The sequence illustrates that the cancellation of opposite-polarity field concentrations produces heated features with EB-like behaviour.
Current usage metrics show cumulative count of Article Views (full-text article views including HTML views, PDF and ePub downloads, according to the available data) and Abstracts Views on Vision4Press platform.
Data correspond to usage on the plateform after 2015. The current usage metrics is available 48-96 hours after online publication and is updated daily on week days.
Initial download of the metrics may take a while.